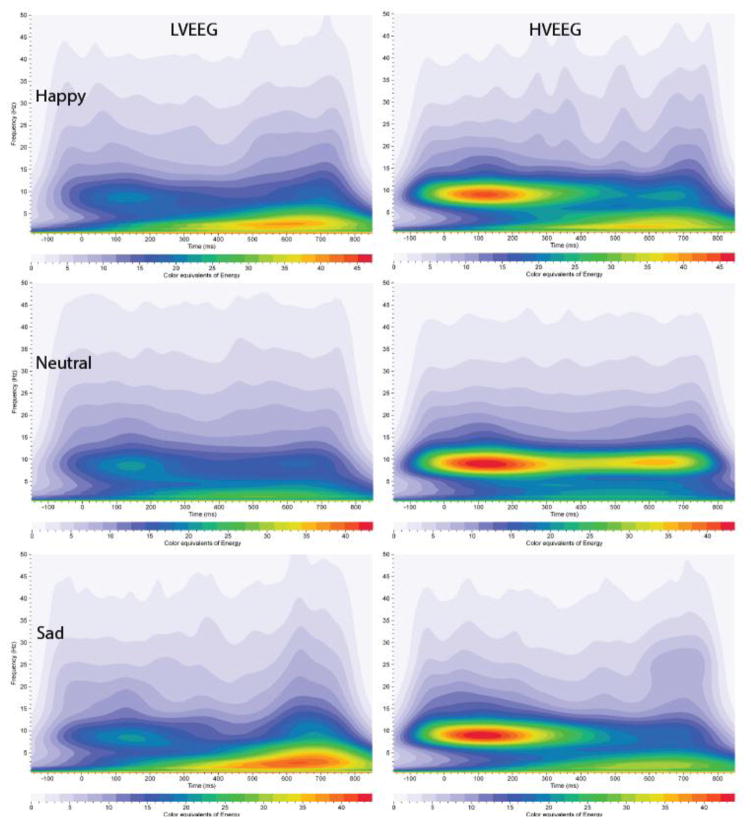
Figure 1. Grand averages of Energy for Event–Related Oscillations (EROs).
Time-frequency representation of energy shown for electrode location PZ following the visual recognition task for low and higher voltage EEG variants (HVEEG). Responses to the three task conditions (rows) are shown for the LVEEG (left column) and higher EEG voltage (right column) variants. In each graph, frequency (Hz) is presented on the Y-axis, time regions of interest on the X-axis (msec). Energy is presented as color/shade equivalents as indicated on the bar at the bottom of each graph.

