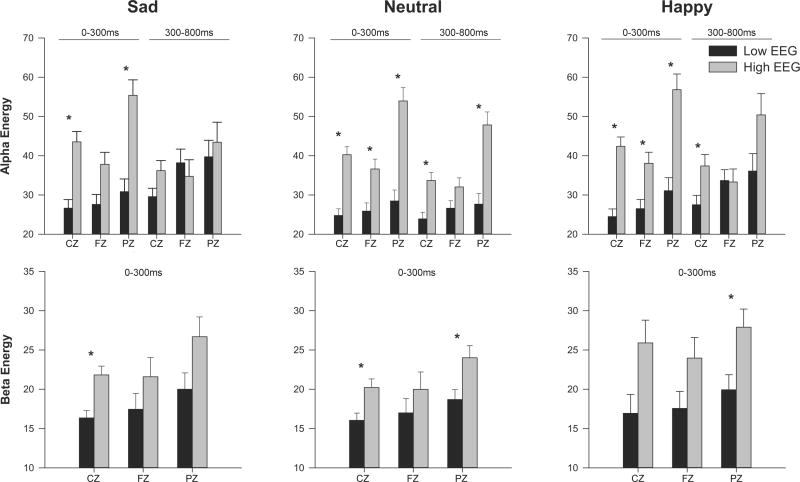
Figure 2. ERO Energy in Alpha and Beta Frequency Bands.
Adjusted mean values (ANOVA co-varied for age) for energy of event-related oscillations (EROs) following the visual recognition task for individuals with LVEGG (black bars) and those with higher EEG voltage (grey bars). Channels shown on the x-axis (CZ, FZ, and PZ) for each time window indicated. * indicates p<0.01. Error Bars = S.E.M.

