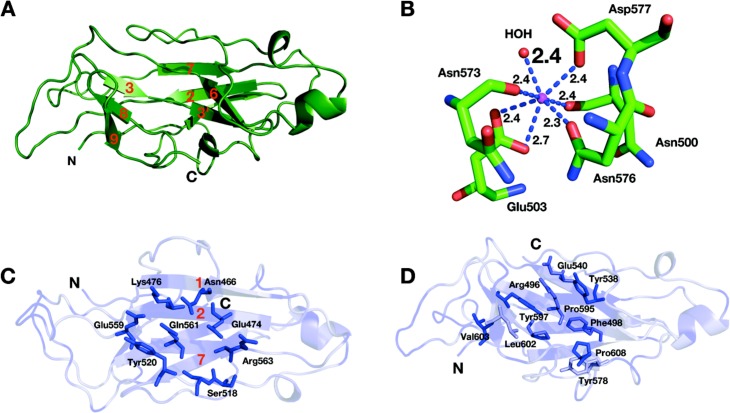
Figure 5. Structure of the CBM3c of Cel9I from C. thermocellum.
C and N termini are indicated (A). Cartoon representation, β-strands are numbered according to the alignment with Cel9G from C. cellulolyticum, and Cel9A from T. fusca. (B) Calcium-binding site of the CBM3c. (C) Birds-eye view of the flat surface. Residues are shaded according to their degree of conservation with C. cellulolyticum Cel9G and T. fusca CEL9A. Surface-exposed conserved residues are shown in stick representation. (D) Shallow groove of the CBM3c. Conserved surface residues are shown in stick representation. The residues are colored according to the degree of conservation in CBM3a, CBM3b and CBM3c modules derived from the sequences listed in the Methods section.

