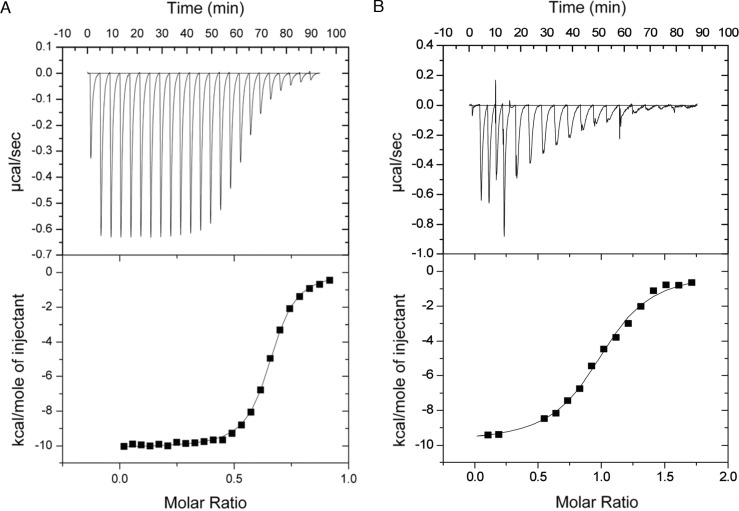
Figure 7. Representative ITC titration of (A) GH9 and CBM3cNL (B) GH9 and CBM3cL.
The top panel shows the calorimetric titration and the bottom panel displays the integrated injection heats corrected for control dilution heat. The solid line is the curve of the best fit used to derive the binding parameters, and the fitted data describe an interaction of a one binding site model.

