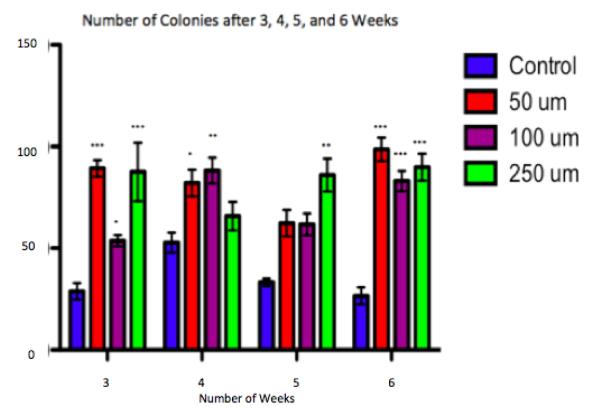
Figure 2. Time Series of Transformation.
After three, four, five and six weeks of chronic exposure to sodium tungstate, Beas-2B cells were placed into soft agar in order to evaluate the temporal induction of anchorage independent growth. Untreated controls grew significantly fewer colonies than W-treated cells at each time point. At each of the four time points, colony formation seemed to be variable amongst the doses. This figure shows that after three weeks of chronic treatment, W-treated cells became transformed at each dose. * p-value<0.05, ** p-value<0.01, *** p-value<0.001 compared to control

