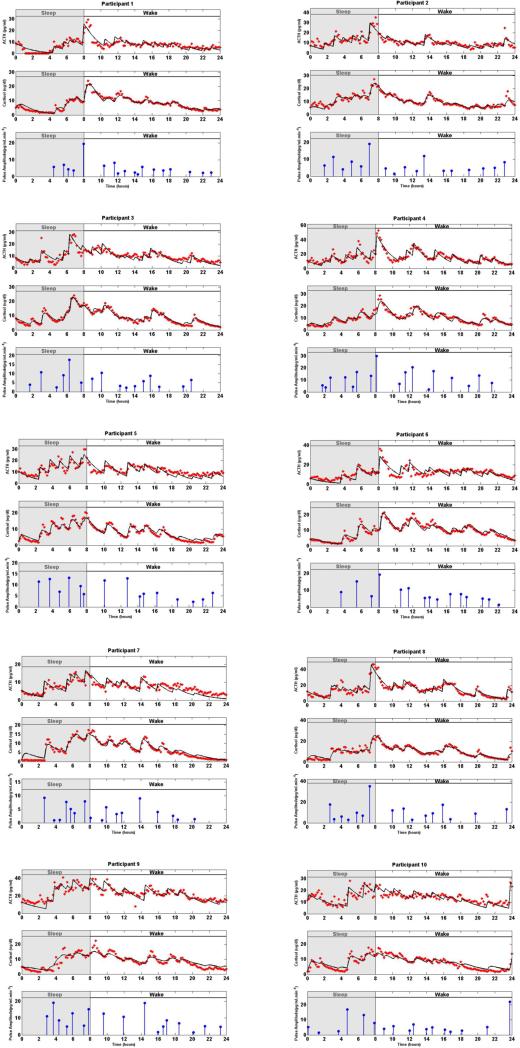
Fig. 1. Estimated Deconvolution of the Experimental Twenty-Four-Hour Concurrent ACTH and Cortisol Levels in 10 Women.
In each panel, (i) the top sub-panel shows the measured 24-hour ACTH time series (red stars), and the estimated ACTH levels (black curve), (ii) the middle sub-panel shows the measured 24-hour cortisol time series (red stars), and the estimated cortisol levels (black curve), (iii) the bottom sub-panel shows the estimated pulse timing and amplitudes (blue vertical lines with dots) using concurrent measurements of ACTH and cortisol for the corresponding participant. The shaded gray area corresponds to sleep period and the white area corresponds to wake period. The estimated model parameters are given in Table 1.

