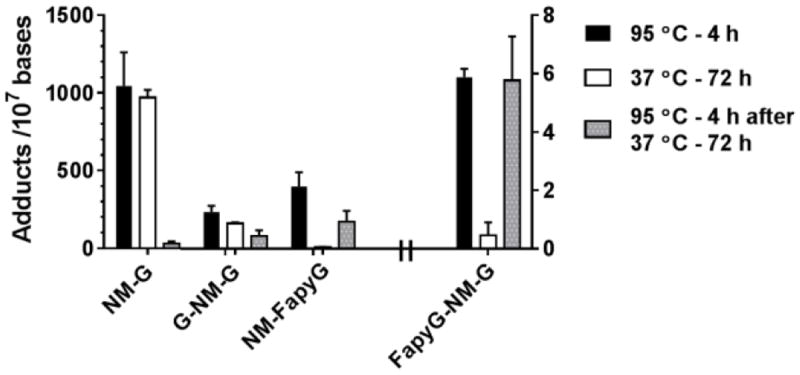
Figure 7.

NM DNA adducts in MDA-MB-231 cells treated with NM (100 μM) for 24 h. Isolated DNA was hydrolyzed as described in Fig. 5 (N = 4 and reported as the average and SD of 2 independent experiments performed in duplicate). Levels of FapyG-NM-G are reported with the right Y scale, all other adducts are reported with the left Y scale
