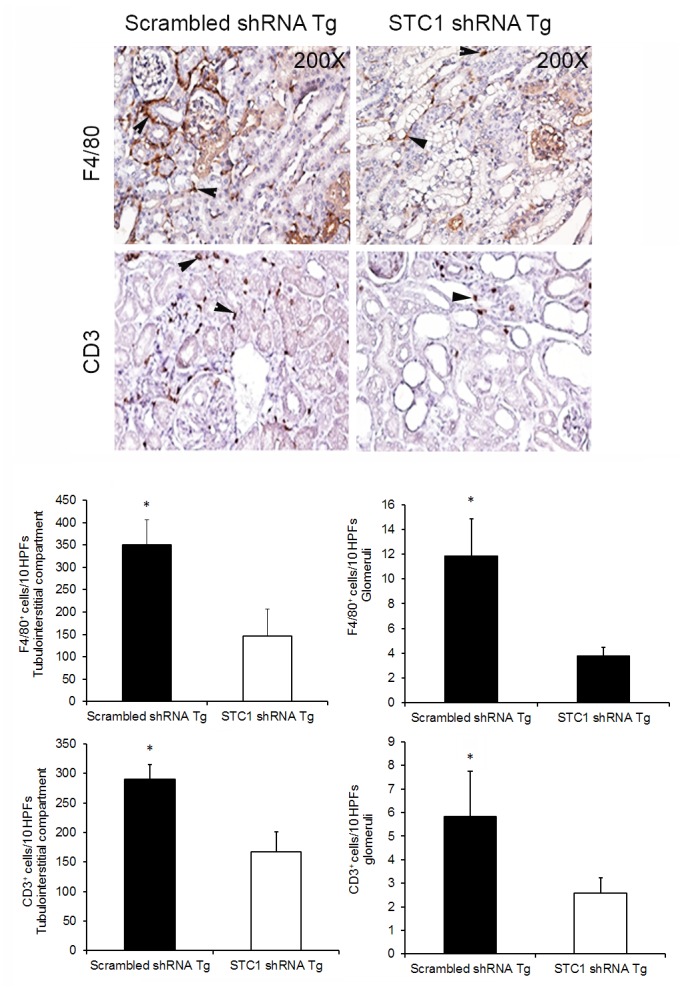
Fig 6. Diminished infiltration with macrophages and T-cells after nephrotoxic nephritis in STC1 knockdown kidneys, compared with controls.

Top panels show representative images for F4/80+ (macrophages and dendritic cells) and CD3+ (lymphocytes) staining; arrowheads point to positively stained cells; 200X magnification. Bar graphs depict macrophage and T-cell count in the glomeruli and interstitial compartment (see methods); data represent the means and ± SEM of 5–7 independent determinations. *, P<0.05.
