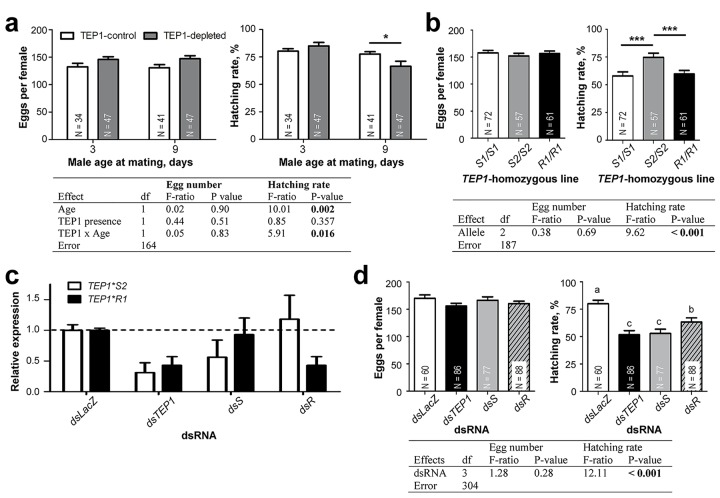
Fig 4. Allele-specific function of TEP1 in male fertility.
Males (3- and 9-d-old) were mated with 3-d-old females. The mean ± SEM of laid eggs and the proportions of hatched larvae are plotted. N, number of oviposited females. (A) Fertility rates of TEP1-depleted (7b line) and TEP1-control (T4 line) males. (B) The fertility of TEP1-homozygous (S1/S1, S2/S2, or R1/R1) males mated with TEP1*S1/S1 females. (C) 1-d-old TEP1*S2/R1 males were injected with dsTEP1*S2- (dsS) or with dsTEP1*R1-(dsR), and 12 d later, relative expression levels of TEP1 were gauged by allele-specific quantitative reverse transcription PCR (qRT-PCR). Injection of dsLacZ and dsTEP1 served as a negative and a positive control, respectively. Expression of a gene encoding ribosomal protein L19 (RpL19) was used for normalization. Results of three independent experiments are plotted. (D) 1-d-old TEP1*S2/R1 males were injected with dsTEP1*S2- (dsS) or with dsTEP1*R1-(dsR) and mated 8 d later with TEP1*S1/S1 females. Injection of dsLacZ and dsTEP1 served as a negative and a positive control, respectively. Results of two-way ANOVA tests are shown in tables below the corresponding graphs. Statistically significant differences in (A,B): * p < 0.05; *** p < 0.001, post hoc Tukey’s test, and in (D): p < 0.05 (Fisher’s LSD test), are indicated by characters above the corresponding values. Data used to make this figure can be found in S1 Data.

