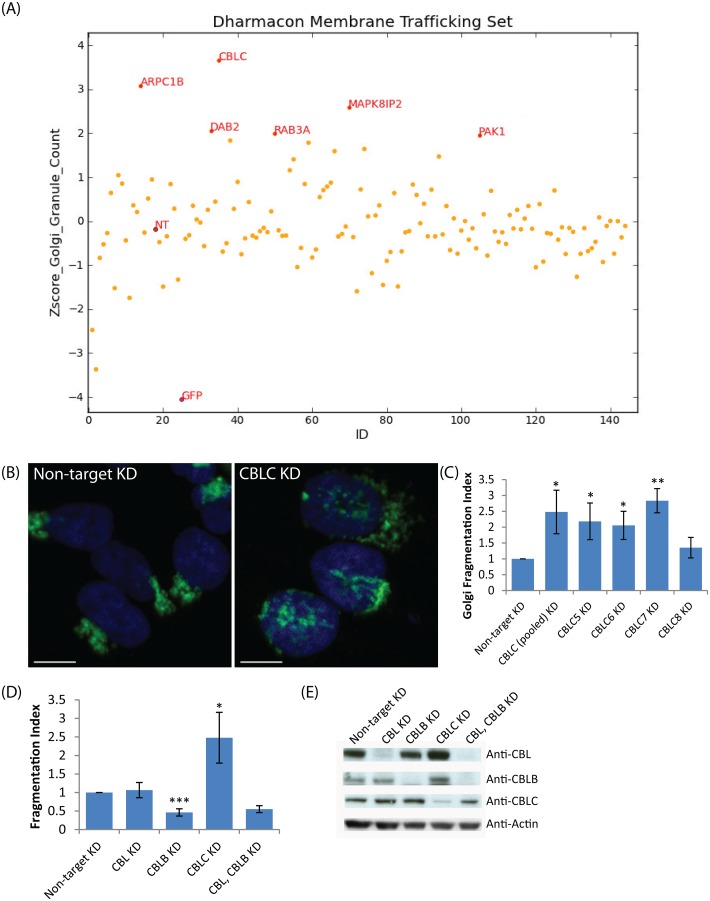
Fig 1. A targeted RNAi screen for Golgi organization identifies CBLC as a Golgi regulator.
(A) Plot of granule count of MannII-GFP signal per cell (Z-score) for 120 genes screened. NT: Nontargeting siRNA (B, C) Golgi fragmentation in wild-type HeLa with individual siRNAs. (B) Giantin (green) and Hoechst (blue) staining HeLa cells, CBLC depletion with pool of siRNA. (C) Golgi Fragmentation Index with pool and single siRNAs, measured in triplicates on at least 800 cells per condition. Error bars show SD statistical significance (p) measured by unpaired Student’s t-test. (*) represents p<0.05, (**) represents p<0.01 and (***) represents p<0.001 relative to non-target siRNA transfected cells. Scale bar = 10 μm. (D) Golgi fragmentation Index after targeting Cbl family members, siRNA pools (E) Western blot analysis of CBL, CBLB and CBLC depleted cells.

