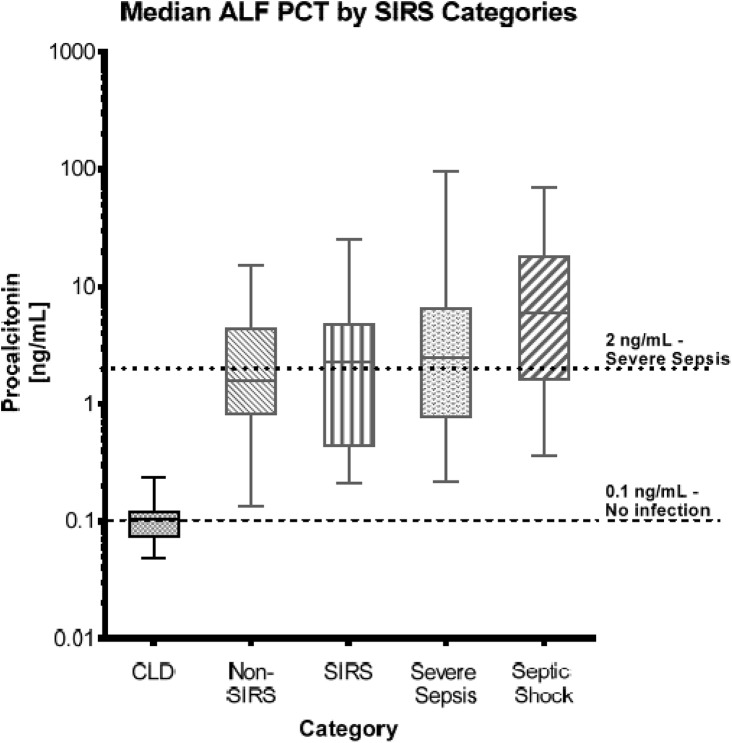
Fig 1. Median PCT Values by Category.
This graph represents the median PCT values for the five patient severity groups. The lower dashed horizontal line represents the 0.1 ng/mL PCT cut-off value indicative of no infection. The upper dotted horizontal line represents the 2.0 ng/mL PCT cut-off value indicative of severe sepsis.

