Fig. 6.

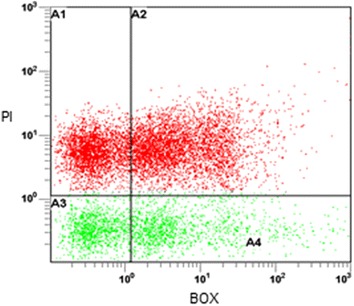
Flow cytometry (FCM) of the E. coli BL21LF strains in an aqueous-octane culture system. Green fluorescence of cells (axis X) due to BOX is plotted versus red fluorescence (axis Y) due to PI. Samples were taken from the batch reactor at 24 h

Flow cytometry (FCM) of the E. coli BL21LF strains in an aqueous-octane culture system. Green fluorescence of cells (axis X) due to BOX is plotted versus red fluorescence (axis Y) due to PI. Samples were taken from the batch reactor at 24 h