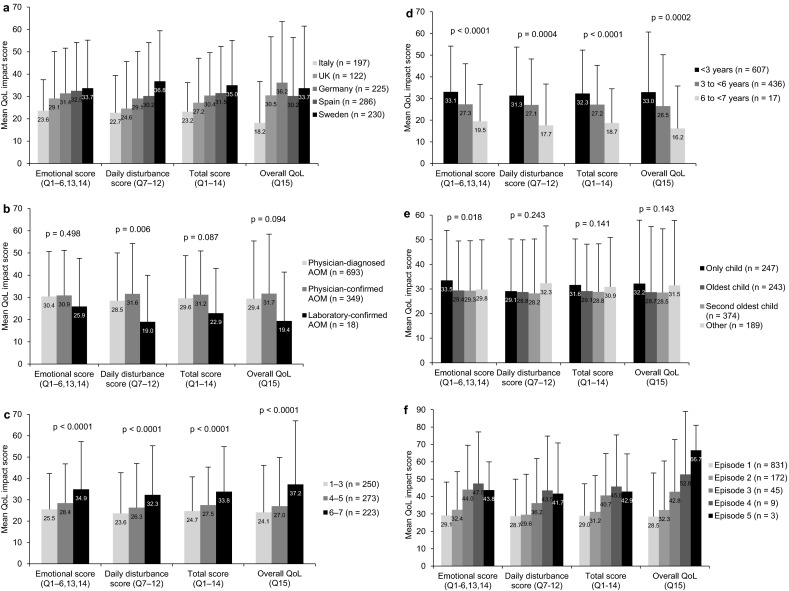
Fig. 2.

Mean ± standard deviation (SD) parental quality-of-life (QoL) impact scores (0 = best to 100 = worst) by a country, b level of diagnostic certainty, c parental AOM Faces Scale score [21] (1 = least severe to 7 = most severe; not used in Sweden), d child age at the time of the AOM episode, e sibling status and f number of episodes of AOM. p values: Kruskall Wallis test was used for across-group comparisons. AOM acute otitis media, Q question
