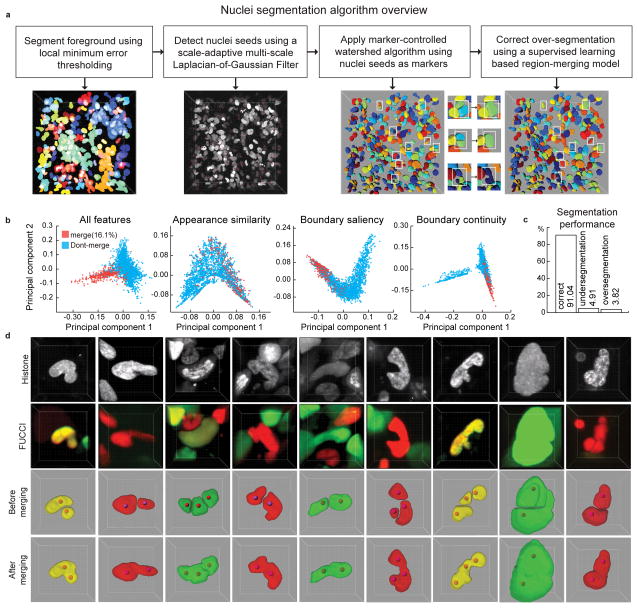
Figure 2. Automatic segmentation of cell nuclei.
(a) Steps of segmentation algorithm. Intermediate results of each step are visualized in 3D. Parameters of the seed point detection filter are tuned to lean towards over-segmentation of the nuclei which are then detected and corrected in the merging step (white boxes). (b) 2D projections of the high-dimensional feature-space representations of the cell nuclei using all features, and the features only in appearance similarity group, boundary saliency group, and the boundary continuity group, respectively. The 2D projections were obtained using a non-linear dimensionality reduction technique called Laplacian Eigenmap. (c) Performance of the segmentation algorithm on a dataset of 54 volumes (Supplementary Table 2–3) out of which 26 volumes were used to train the classification model that is used to guide the region merging process and the remaining 28 were used to evaluate the performance of the segmentation algorithm. The segmentation quality was scored manually with a software tool that presents each cell one by one to a human observer who then specified whether it was well-segmented, over-segmented or under-segmented. We report the average of per-stack percentages of cells that were well-segmented, under-segmented or over-segmented in the test dataset. (d) A few examples of multi-nucleated cells with non-spherical shapes that were correctly segmented using a two-step strategy of initial over-segmentation followed by region merging. Red spheres: seed-points used in an initial marker-controlled watershed algorithm.

