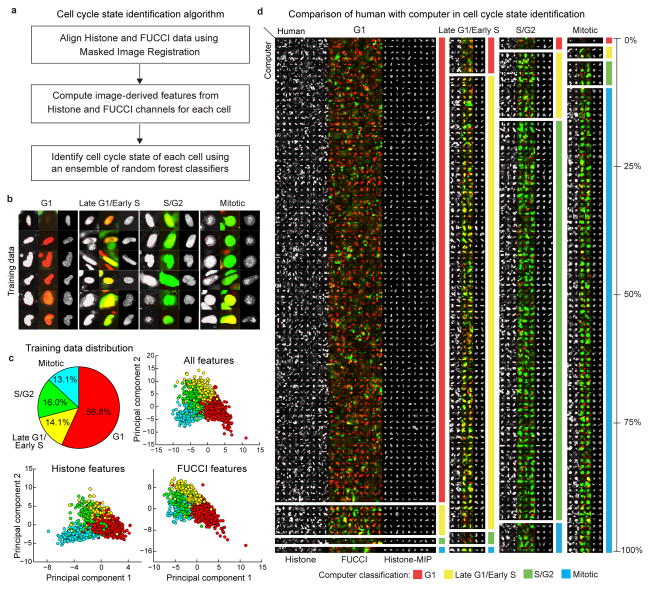
Figure 3. Automatic identification of cell cycle state.
(a) Steps of cell cycle state identification algorithm. (b) Examples of cells from each cell cycle state in our training dataset. (c) Class distribution (top-left) in training dataset and 2D projections (obtained by Linear Discriminant Analysis, LDA) of the feature-space representations (Online Methods, Supplementary Table 4) using all features (top-right), and features only in the histone (bottom-left), and FUCCI channels (bottom-right), respectively. (d) A pictorial depiction of the confusion matrix (Supplementary Table 3) showing the agreement/disagreement between human observer and computer in identifying the nuclei of each cell cycle state in a dataset of 53 volumes (25 used for training the classification model, the remaining 28 to evaluate the performance). The height of each block is proportional to the corresponding element in the row-normalized confusion matrix. The large blocks on the diagonal represent agreement between human and computer, other blocks represent disagreement. Due to space limitations only 30% of all cells in our dataset are shown. Thumbnails in (b) and (d): mid-axial cross-section of the histone channel (left) and FUCCI red-green-overlay (middle), maximum intensity projection (MIP) of the histone channel (right). In all panels, the cell thumbnails represent 35×35 μm by default. Larger cells were scaled to fit.

