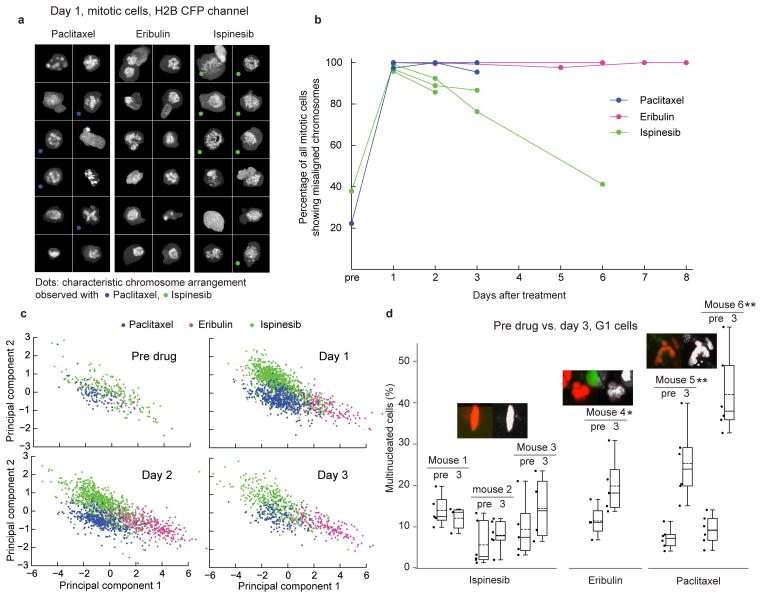
Figure 6. Antimitotic drugs induce different mitotic and interphase phenotypes.
Examples of cell morphology induced by antimitotic drugs (same datasets as Fig. 5) (a) Random sample of cells imaged on day 1 after drug injection and identified by the analysis framework as mitotic. MIPs of histone channel, representing condensed chromosomes. Note the ability to automatically detect cells with different characteristic morphology for each drug. (b) Percentage of spindles with misaligned chromosomes over time. Each line represents one mouse. All grid positions of a given mouse at an imaged timepoint were pooled. Datapoints with fewer than 9 mitotic cells in total (due to very low mitotic index) are not shown. (c) 2D projections (obtained by LDA) of a high-dimensional space of texture features of mitotic cells at four consecutive time points. The mitotic phenotypes induced by the three drugs form distinct clusters, confirming the morphologic differences shown in Fig. 6a. (d) Representative examples of phenotypes of G1 cells in drug-treated tumors from Fig. 5. Note that ispinesib-treated and untreated cells are mononucleated in morphology while eribulin induces a mild and paclitaxel a severe multinucleated phenotype. In (a) and (d), single-cell thumbnails are by default 35×35 μm in size. Larger cells were scaled to fit. A one-sided t-test was used to compare the mean percentage of multinucleated cells on day 3 after drug treatment with the pre-drug time point. *P<0.05, **P<0.005. Box plots as in Fig. 4d, dashed lines show the mean.

