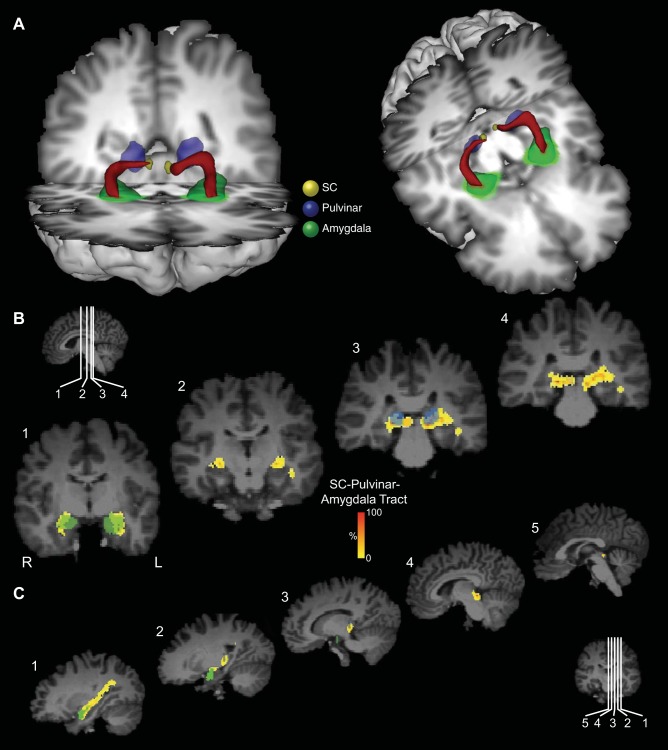
Fig. 2.
Probabilistic tractography between the SC and the amygdala via the pulvinar in one representative participant from the first group. A: three-dimensional (3D) reconstructions of the tract (shown in red) linking the SC (shown in yellow) and the amygdala (shown in green) via the pulvinar (shown in blue). Tracts have been thresholded by 10% (see methods for details). The individual structures and tracts in the 3D reconstructions have been dilated by 2–4 mm for visualization purposes only. Coronal (B) and sagittal (C) sections show the location of the tract relative to the amygdala (green), pulvinar (blue), and SC (yellow). The probabilistic data are presented unthresholded (and actual size) as a percentage of the total number of traces linking the SC and amygdala (that pass through the pulvinar).

