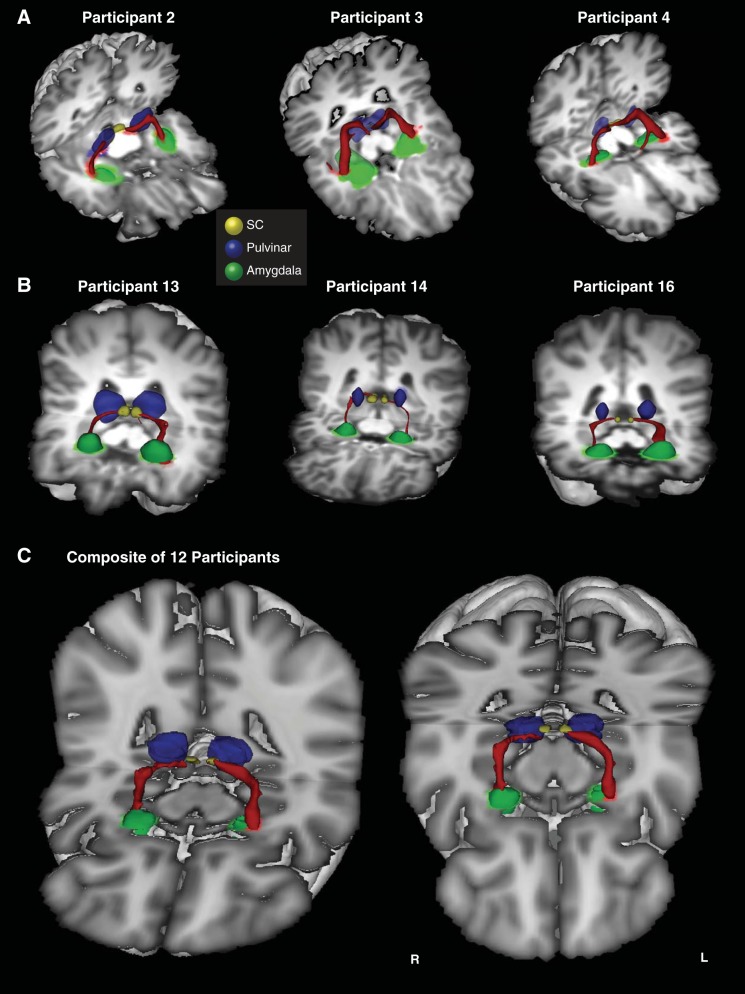
Fig. 3.
3D reconstructions of the SC-pulvinar-amygdala tract (shown in red) in 3 additional representative participants from the first (A) and second (B) groups. Tracts have been thresholded by 10% (see methods for details). The individual structures and tracts in the 3D reconstructions have been dilated by 2–6 mm for visualization purposes only. C: composite tract of all 12 participants from the second group (higher resolution). The composite tract has been thresholded such that only voxels that were identified in at least 75% of participants are shown.

