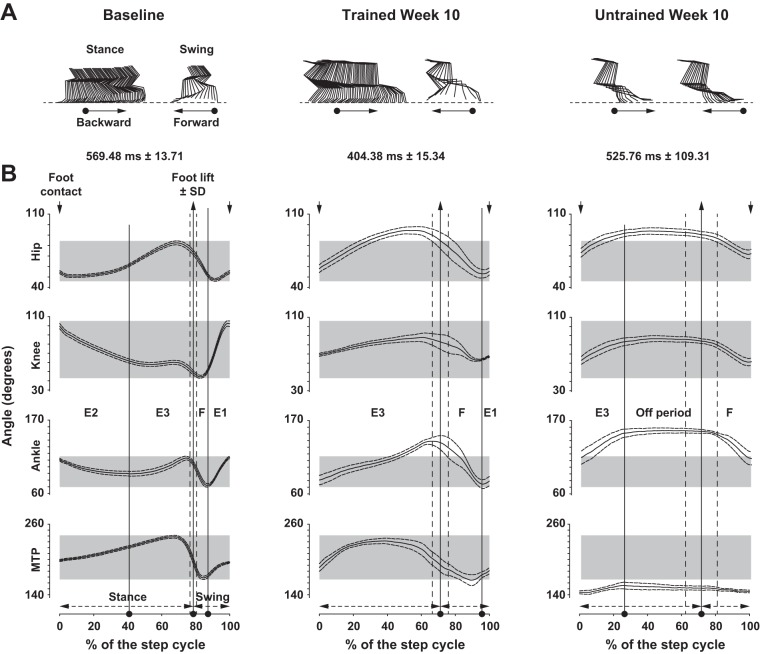
Fig. 3.
Recovery of angular excursions. A: stick figures of stance and swing phases from representative rats before (left) and at week 10 after SCI in trained (center) and untrained (right) groups. The direction of movement is given (arrows). B: angular excursions averaged by groups of hip, knee, ankle, and metatarso-phalanx (MTP) before (left) and at week 10 in trained (center) and untrained (right) groups. Step cycle duration (x-axis) is normalized in % of the step cycle beginning and finishing with a foot contact (down arrows at top). Average ± SE duration of the step cycle is depicted above each panel. The position of foot lift ± SD (up arrows at top), the proportion of stance and swing phases (bottom), and the Philippson's subphases are also given. The “off period” (right) corresponds to the absence of active hindlimb movement. Data were recorded at 14 m/min and are expressed as means ± SE.

