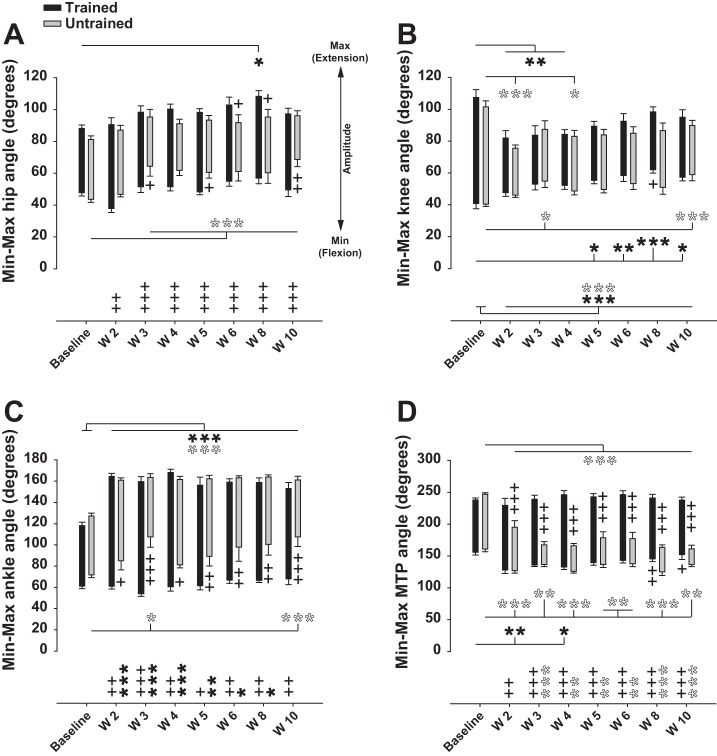
Fig. 4.
Recovery of hindlimb angle joint amplitude after SCI. A: averaged minimum, maximum, and amplitude of hip joint angle during locomotion on treadmill before and weekly after SCI in trained and untrained rats. B: same as A for knee joint angle. C: same as A and B for ankle joint angle. D: same as A–C for MTP joint angle. Black and white asterisks below and above the sticks represent the statistical comparison of minimum and maximum angle values with baseline in trained and untrained groups, respectively. Plus signs below and above the sticks represent the statistical comparison between both groups for minimum and maximum angle values, respectively, at each time point. Symbols at bottom graphs relate to the angle amplitude (max − min illustrated by length of sticks) and follow the same rules as described above. Data were recorded at 14 m/min and are expressed as means ± SE. *P ≤ 0.05, **P ≤ 0.01, ***P ≤ 0.001, compared with group average baseline; +P ≤ 0.05, ++P ≤ 0.01, +++P ≤ 0.001, for comparison between experimental groups at the same time point after SCI.

