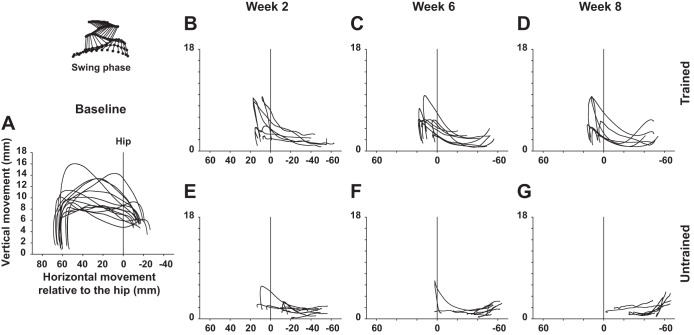
Fig. 6.
Evolution of hindlimb foot trajectory during the swing phase after SCI. A: superimposed averaged trajectory of the third toe in normal rats during the swing phase of locomotion on treadmill. Scale of the y-axis (vertical foot displacements) is increased (zoomed in) compared with the x-axis for better depiction and comparison of the vertical amplitude. Vertical line labeled as Hip represents the vertical projection of the great trochanter and corresponds to the reference (0 value) on the x-axis. B–D: representations similar to A in trained rats weeks 2, 6, and 8 after SCI, respectively. E–G: representations similar to B–D in untrained rats at the same time points. Data are expressed as averaged instant position relative to the hip (x-axis) and the treadmill belt (y-axis).

