. 2015 Aug 27;4:e09221. doi: 10.7554/eLife.09221

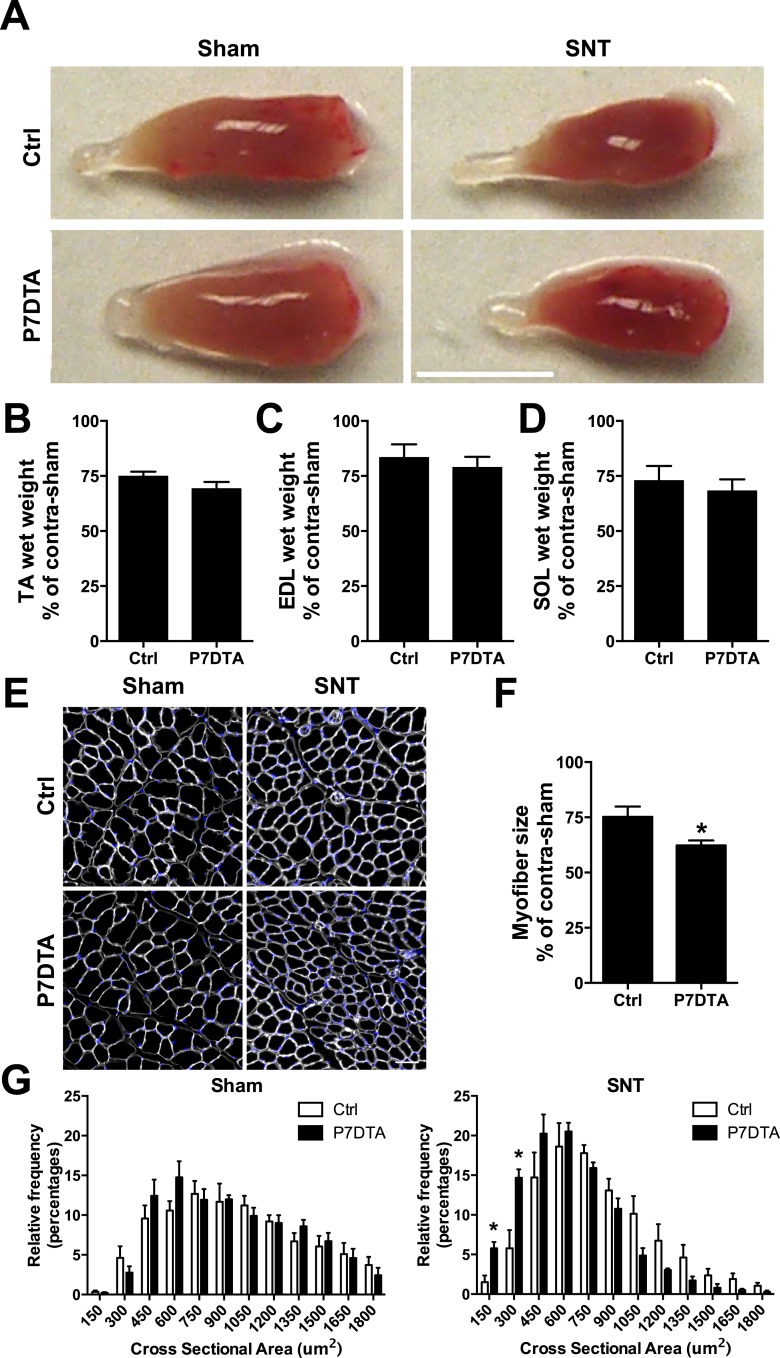
Figure 2. SC depletion exacerbates neuromuscular disruption induced myofiber atrophy.

(A) Representative images of TA muscles. Scale bar = 5 mm. (BD) Quantification of (B) TA (C) EDL and (D) Soleus (SOL) muscle wet weight after SNT as a percentage of contralateral sham. N = 6 for Ctrl and 8 for P7DTA. (E) Representative TA sections stained with anti-Laminin (white) and DAPI (blue). Scale bar = 50 μm. (F) Quantification of TA myofiber size as a percentage of contralateral sham. (G) Histograms of TA myofiber size distributions. N = 4 mice, >1000 myofibers/mouse. *p < 0.05, t-tests.

DOI: http://dx.doi.org/10.7554/eLife.09221.004

Figure 2.

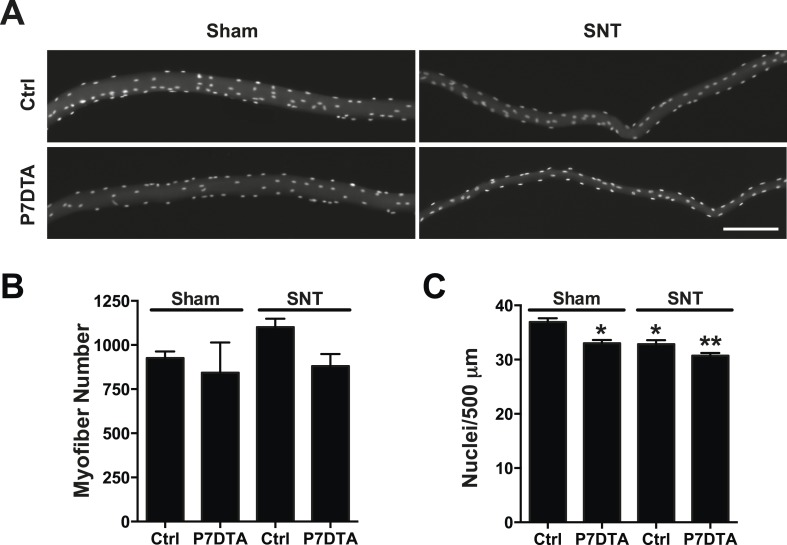
Figure 2—figure supplement 1. Retention of myofibers and modest loss of myonuclei 6 weeks after SNT.

Figure 2—figure supplement 1.

(A) Representative images of single isolated myofibers from EDL muscles (fixed prior to isolation from lower limbs), stained with DAPI. (B, C) Quantification of EDL (B) myofiber number and (C) myonuclei number per 500 μm. N = 4 mice, 32 myofibers/mouse, *p < 0.05 compared to Ctrl-sham, **p < 0.05 compared to Ctrl-sham, Ctrl-SNT, and P7DTA-sham ANOVA/Bonferroni multiple comparisons test and t-tests.