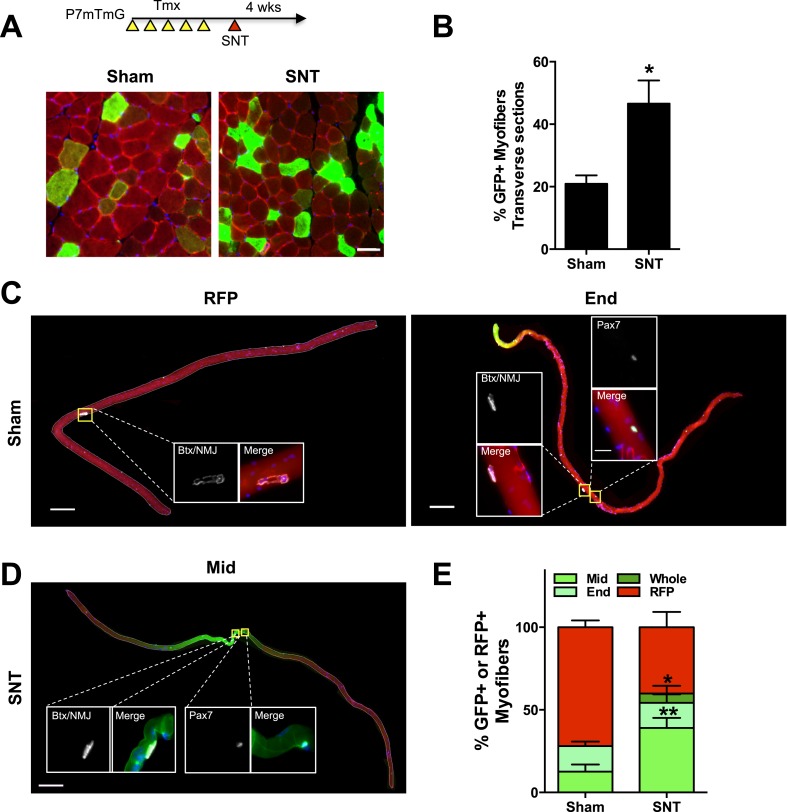
Figure 7. Neuromuscular disruption stimulates SC contribution in the vicinity of NMJs.
(A) Scheme demonstrating time of tamoxifen treatment, SNT surgery, and harvest of tissue. Representative images to examine GFP label in myofibers and Pax7+ SCs of P7mTmG skeletal muscles 4 weeks after sham and SNT surgery. (B) Quantification of the percentage of GFP + myofibers from midbelly of EDL muscles 4 weeks after sham or SNT surgery. Scale bar = 50 μm. N = 3 mice, 3 sections/mouse, 6 fields/section. *p < 0.05, t-tests. (C, D) Representative images of single isolated P7mTmG EDL myofibers with no GFP (RFP), GFP at ends (End) or GFP in middle portions where neuromuscular junctions (NMJs) are located (Mid) after (C) sham or (D) SNT surgery. Magnified inset images show SCs (Pax7+) or NMJs (Btx, AChRs). Scale bar for myofibers = 200 μm for inset = 25 μm. (E) Quantification of GFP + fiber percentage and distribution. Note a higher percentage of myofibers after SNT express GFP primarily in the Mid regions, the location of NMJs. N = 4 mice, 25 myofibers examined per mouse. *p < 0.05 for all GFP + groups, **p < 0.05 for Mid GFP, t-tests.


