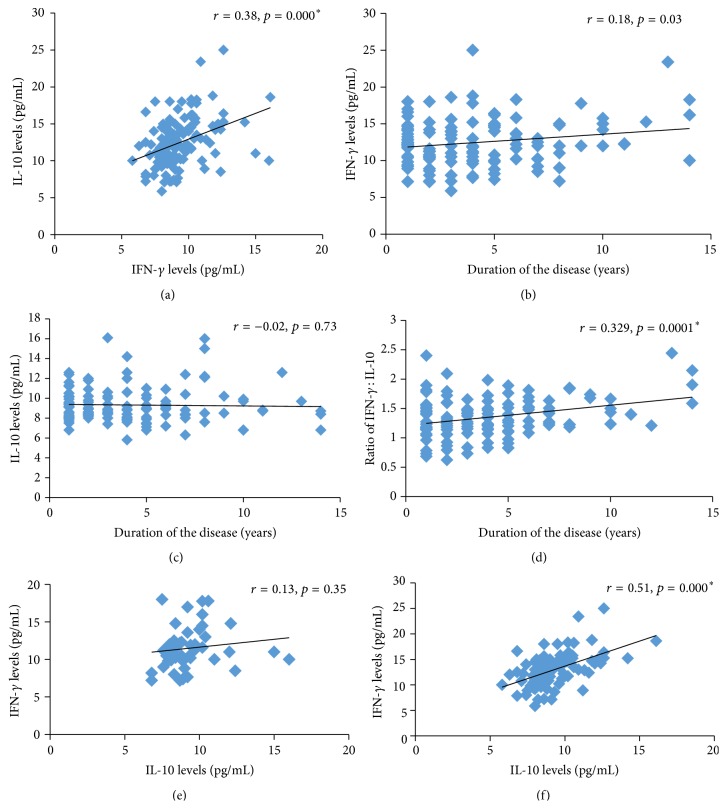
Figure 2.
Representing correlation of (a) IL-10 and IFN-γ levels in patients, (b) duration of the disease with IFN-γ levels, (c) duration of the disease with IL-10 levels, (d) duration of the disease with IFN-γ : IL-10 ratio, (e) IL-10 with IFN-γ levels in stable vitiligo patients, and (f) IL-10 with IFN-γ levels in active vitiligo patients.

