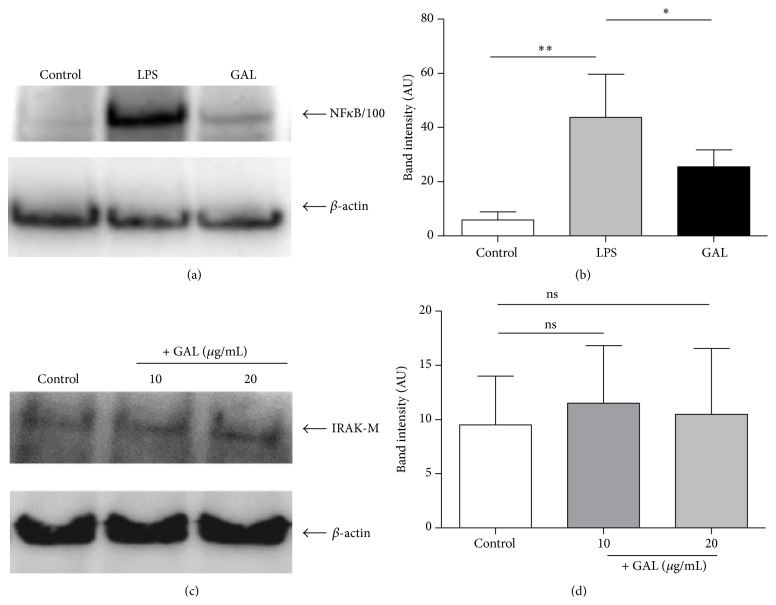
Figure 3.
The NFκB2/p100 accumulation after the first LPS or GAL challenge. Cultures of human macrophages were challenged with 10 ng/mL LPS or 10 μg/mL GAL for 24 h. The controls were not treated. The levels of NFκB2/p100 or IRAK-M and β-actin were studied by Western blot analysis of the cytosolic fraction. (a) A NFκB2/p100 standard blot is shown (n = 6). (b) Densitometry analysis: arbitrary units [AU] of NFκB2/p100 bands are normalized with respect to β-actin (n = 6). ∗ p < 0.05, ∗∗ p < 0.01 compared with LPS. (c) A IRAK-M standard blot is shown (n = 3). (d) Densitometry analysis: arbitrary units [AU] of IRAK-M bands are normalized with respect to β-actin (n = 3).

