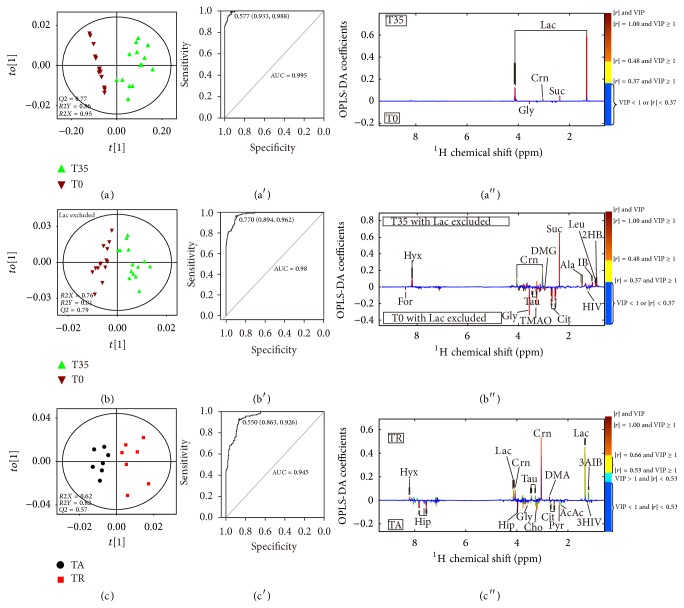
Figure 3.
OPLS-DA scores plots of 1H NMR data, ROC maps, and OPLS-DA coefficient plots of 1H NMR data derived from PLS-DA models of T35 versus T0 groups (a, a′, and a′′), T35 versus T0 groups (b, b′, and b′′) with lactate excluded, and TA versus TR group (c, c′, and c′′). The abbreviations of metabolites are denoted in Table S1 as shown in the Supplementary Material.

