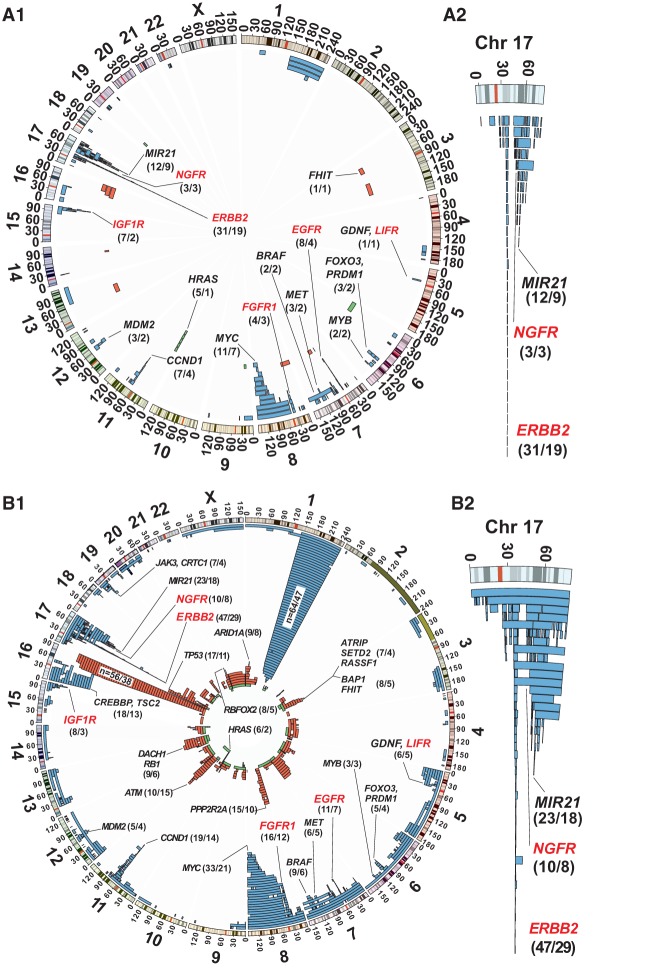
Figure 2.
Position and frequency of post-zygotic copy number aberrations in UM samples from 282 breast cancer patients included in the study. (A1,B1) Genome-wide view of aberrations stratified by size; <105 Mb of total size and up to 1288 Mb for all size-scored aberrations, respectively. (A2,B2) An enlarged view of complex 17q amplicons, targeting ERBB2, NGFR, and MIR21, among other genes, which are also displayed in A1 and B1. Three types of aberrations were detected using whole-genome Illumina SNP-array genotyping, such as gains (blue), deletions (red), CNNLOH/UPD (green), and are displayed using Circos plots (Krzywinski et al. 2009). Recurrent mutations including previously known cancer genes are specified by name. The numbers in parentheses after the gene names indicate the number of UM specimens and the number of cases, respectively, showing variation in each of the recurrent loci. A1 shows the 235 structural aberrations scored in 80 UM samples collected from 50 subjects. This plot displays early aberrations, which are detected in normal UM cells, with a maximum total size of aberrations of <105 Mb. Six genes coding for cell-surface receptors showing recurrent copy number gains are highlighted in red. In B1, a less strict cut-off size limit was used as compared to A1, and 904 size-scored aberrations detected in 156 UM samples collected from 93 cases are plotted. The highly recurrent regions are all-encompassing loci previously described to be of importance in breast cancer (Table 1).

