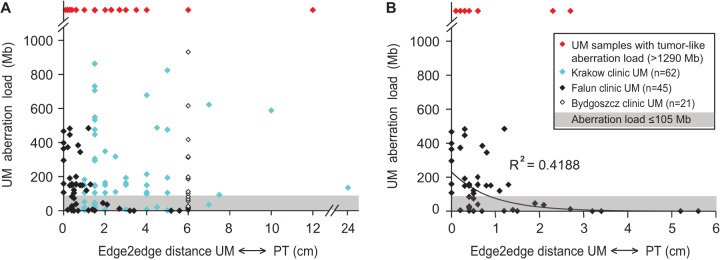
Figure 4.

The total aberration load of UM samples in relation to the distances between UMs and PTs. The “edge2edge” distance was measured as the shortest distance between the borders of the PT and UM samples. For patients with multifocal disease, the distance was measured to the closest primary tumor. In A, combined data from three clinics (Krakow, Falun, and Bydgoszcz) are shown. (B) Falun cases only. The shaded area in both plots illustrates the 105-Mb threshold as defined by our comparative genetic and histological analysis that is described in the text. In our material, no UM samples with an aberration load below the 105-Mb threshold showed any atypical/cancer-like features upon microscopic inspection. Red diamonds highlight UMs in which the total aberration load (i.e., >1288 Mb) was indicative of tumor content in these samples, as explained in the text. The symbols for samples derived from each of the clinics are explained in the box in B. The distances for the Falun cases were measured in a microscope using a large-scale histology format, allowing high precision of measurements, i.e., below 1 mm accuracy. The distances for the other two clinics were measured with a ruler upon dissection of the breast by a pathologist and are less precise. In six instances of UM samples from the Falun clinic, the microscopic investigation of large-format histology preparations resulted in detection of tumor/atypical cells in the area where UM samples were taken, and these UMs are plotted at zero distance from the primary tumor. The trend line was introduced for Falun cases with an R2 value of the correlation coefficient. The UM samples from the Bydgoszcz clinic were collected at a 4- to 8-cm distance from PTs and we used the average distance in this plot, as reflected by the cluster of measurements at the 6-cm distance in A. The plotted data can be found in Supplemental Table 2.
