Figure 5.

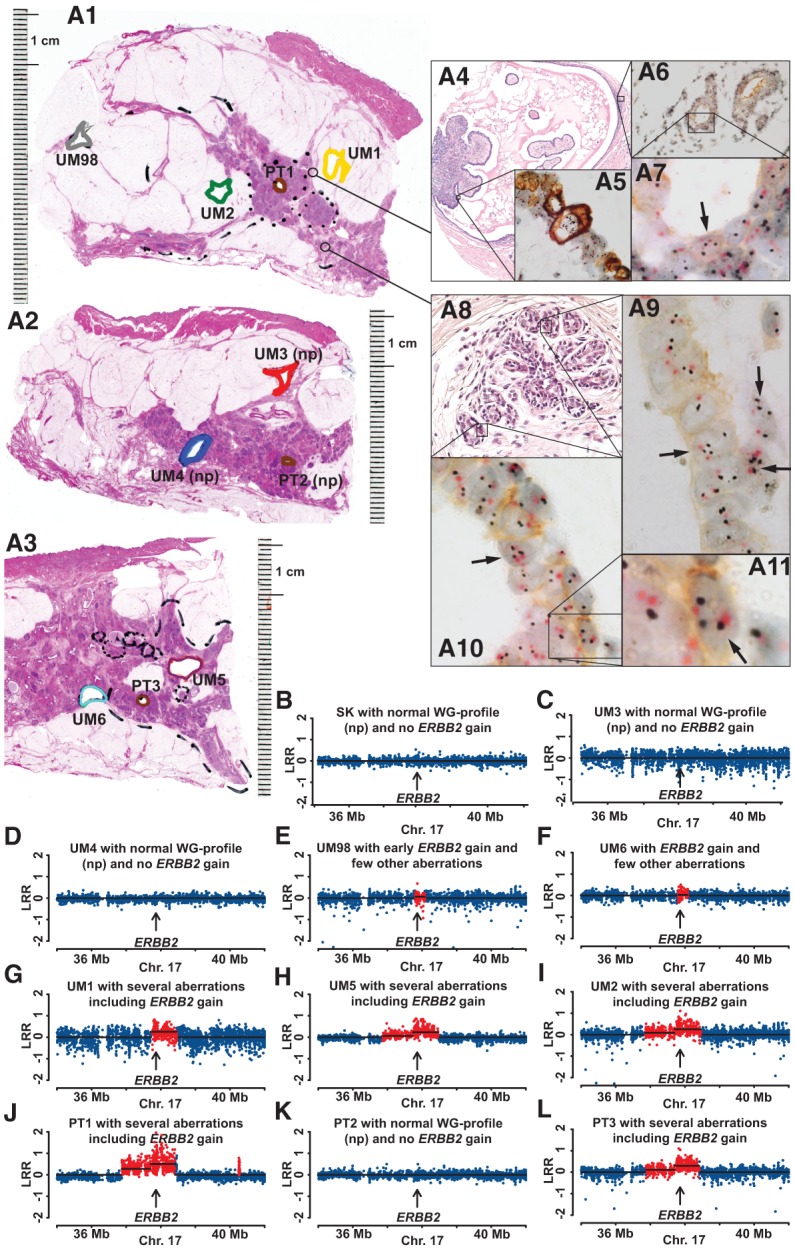
Comprehensive study of pathology and genetics for case MN036, showing increased copy number and expression of the ERBB2 gene in normal epithelial cells. (A1,A2,A3) Three large-format histology slides taken at different levels of the mastectomy specimen stained with hematoxylin and eosin, with diagnosis of multifocal invasive ductal carcinoma (Luminal B, HER2+). Areas of tissue samples taken for DNA extraction, prior to formalin fixation of the tissue, are marked with colored thick lines. Positions of three primary tumors 1, 2, and 3 (PT1, PT2, and PT3) are shown in brown. In A1, UM1, UM2, and UM98 are labeled in yellow, green, and gray, respectively. In A2, UM3 and UM4 are labeled in red and blue, respectively. In A3, UM5 and UM6 are labeled in purple and light blue, respectively. (np) Normal genetic profiles (see also below, B–L). Two cores from paraffin-embedded tissue (thin-lined black circles) from A1 were taken for separate analysis using the HER2 tricolor Dual ISH DNA Probe Cocktail Assay (Roche) and the results are shown in A4–A11. (A4) A papillary structure lined partly by cancer cells and partly by histologically normal epithelium. High-magnification image in A5 shows tumor cells with very strong overexpression of HER2 protein containing up to 20 copies of ERBB2 (black dots). (A6,A7) Histological images of normal breast tissue. Black arrows in A7, A9–A11 point to single nuclei of normal epithelial cells containing more than two copies of ERBB2 (black dots). The centromere of Chromosome 17 is stained in red. A weak but clearly discernible immunohistochemical staining of HER2 protein is visible in the cell membrane of normal epithelial cells upon high magnification. (B–L) A segment of Chromosome 17 containing ERBB2 in 11 samples from Illumina global genome analysis. Skin (SK, normal control tissue), UM3, UM4, and PT2 show no evidence of gain of ERBB2. The remaining seven samples were scored as containing increased copy numbers (red dots) for ERBB2. Note that sample UM98, located at a distance of >4 cm from the PT1 sample, also shows evidence for cells containing an increased number of copies of ERBB2. The total size of aberrations in UM samples is as follows: UM6, 0.4 Mb; UM98, 0.4 Mb; UM1, 0.8 Mb; UM2, 27.7 Mb; UM5, 36.5 Mb.
