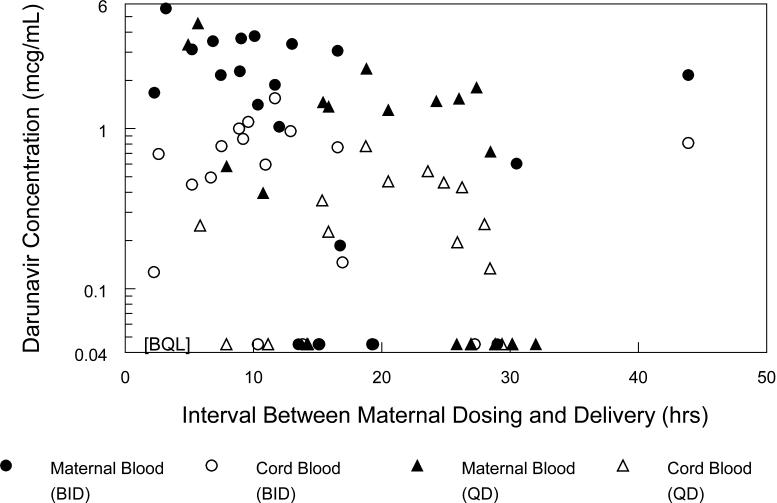
Figure 3.
Maternal darunavir concentrations at delivery and cord blood darunavir concentrations plotted against the time interval between maternal dosing and delivery. Circles present data for twice daily subjects and triangles present data for once daily subjects. Maternal plasma darunavir concentrations at delivery are represented with filled symbols, cord blood darunavir concentrations with open symbols. BQL = below quantitation limit of assay.

