Figure 1.
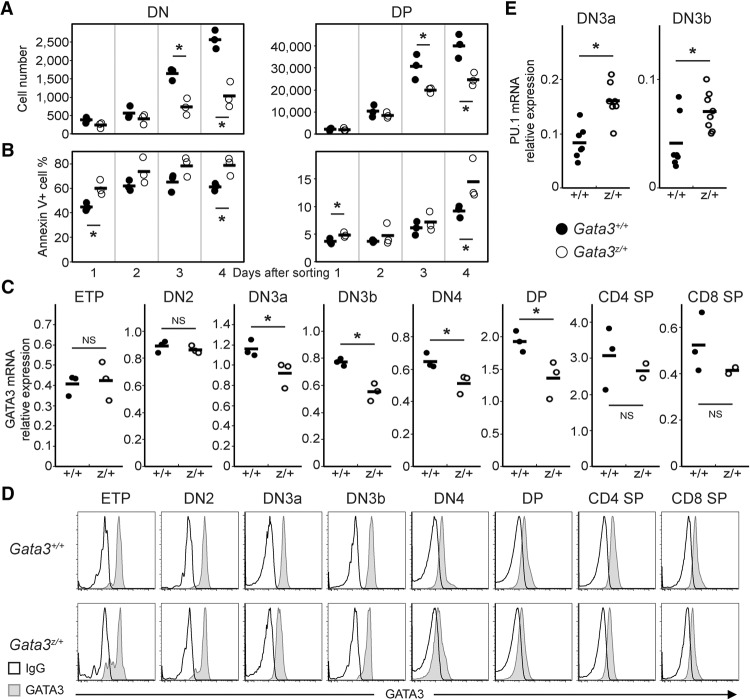
Reduced activity of Gata3 alleles results in reduced expansion of immature T cells and elevated expression of myeloid transcription factor PU.1. (A,B) DN4 stage thymocytes were isolated from Gata3z/+ (○) or Gata3+/+ (•) mice and then cocultured on OP9-DL1 feeder cells. Cells were harvested and stained for CD4 and CD8 coreceptors followed by flow cytometric analysis at the indicated time points (after 1–4 d of coculture initiation) for cell number (A) and apoptosis (by Annexin V staining) (B). The horizontal bar in each genotype panel represents the average value for each analyzed genotype group. Representative data are shown from one experiment examining three mice of each genotype; similar results were collected from at least six mice of each genotype in two independent experiments. (C,E) Quantitative RT–PCR (qRT–PCR) in staged T cells of wild-type (Gata3+/+; •) or heterozygous mutant (Gata3z/+; ○) mice. GATA3 (C) and PU.1 (E) mRNA abundance was quantified using the total reverse-transcribed product from 100 live-cell equivalents of RNA normalized to HPRT mRNA. Each circle represents an individual mouse, and the black bars represent the averages. (*) P < 0.05; (NS) not significant. The data summarize duplicate measurements of three to eight mice of each genotype from at least two independent experiments. (D) Intracellular GATA3 (filled curve) protein abundance in staged T cells from wild-type (Gata3+/+) (top panel) and heterozygous mutant (Gata3z/+) (bottom panel) thymi was monitored by flow cytometry. The open curve represents background (IgG) staining in each sample. Representative histograms are shown as characterized in at least three mice of each genotype.

