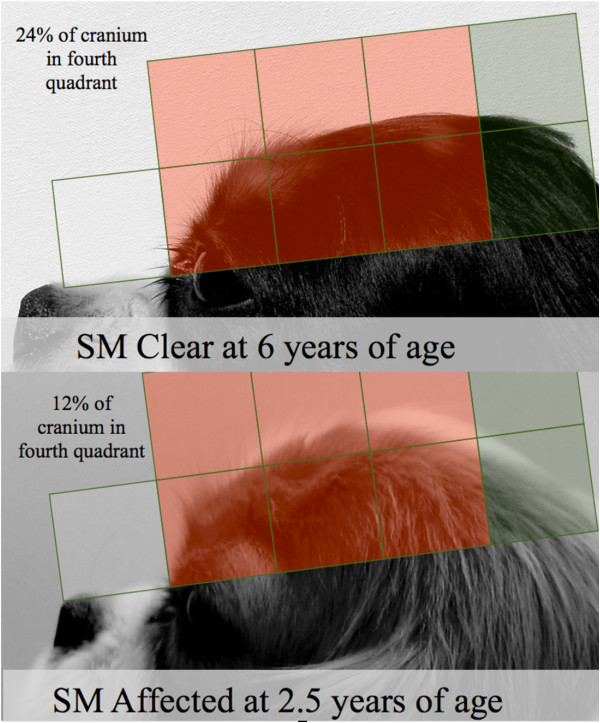
Figure 6.

Example of caudal cranium distribution differences in young affected and older clear individuals. The cranium in the fourth quadrant in the SM clear individual shows an increased coverage of the grid relative to the first, second and third quadrants, resulting in a high percentage distribution in the fourth quadrant of 24%. Conversely, in the early SM affected individual, an increased coverage in the first, second and third quadrants and a decreased coverage in the fourth quadrant leads to a decreased percentage cranium distribution in the fourth quadrant of 12%.
