
Figure 5.
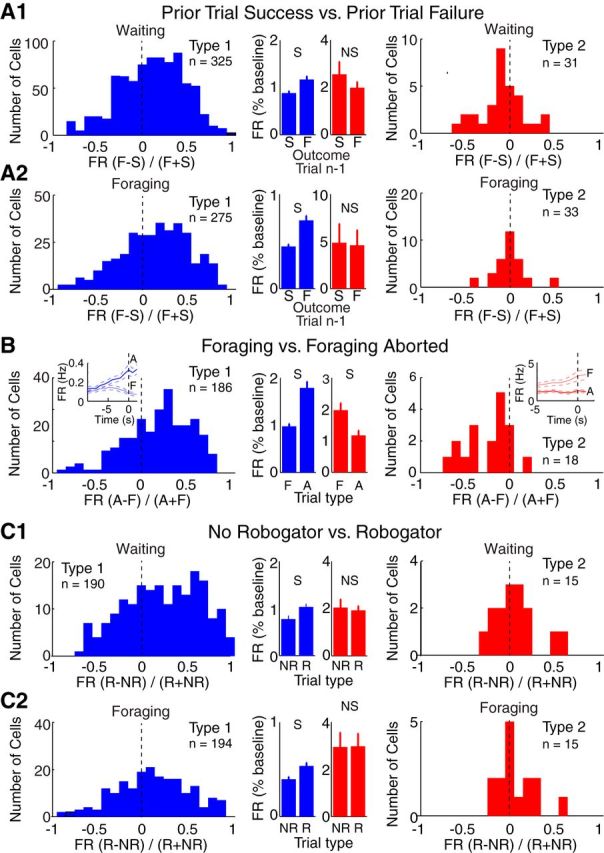
Firing rates of Type-1 and Type-2 PNs as a function of trial type. A–C, Comparison of firing rates as a function of trial type in Type-1 (blue, left) and Type-2 (red, right). Comparisons are as follows: (A) depending on whether the prior Robogator trial was a failure (F) or success (S) during waiting (A1) or foraging (A2); (B) depending on whether waiting at door threshold is followed by retreat back to the nest (A) or foraging (F); (C) depending on whether Robogator was present (R) or not (NR) during waiting (C1) and foraging (C2). Units were only included if ≥5 trials of each type were available and if they fired one spike in at least one trial. These exclusion criteria explain variations in the number of unit recordings considered in the various analyses (Type-1: A1, n = 325; A2, n = 275; B, n = 186; C1, n = 190; C2, n = 194; Type-2: A1, n = 31; A2, n = 33; B, n = 18; C1, n = 15; C2, n = 15). B, Insets, Firing rate as a function of time during waiting period followed by foraging (thin line) versus retreat in the nest (thick line). S, significant at 0.05 level. Central histograms and insets, averages ± SEM.