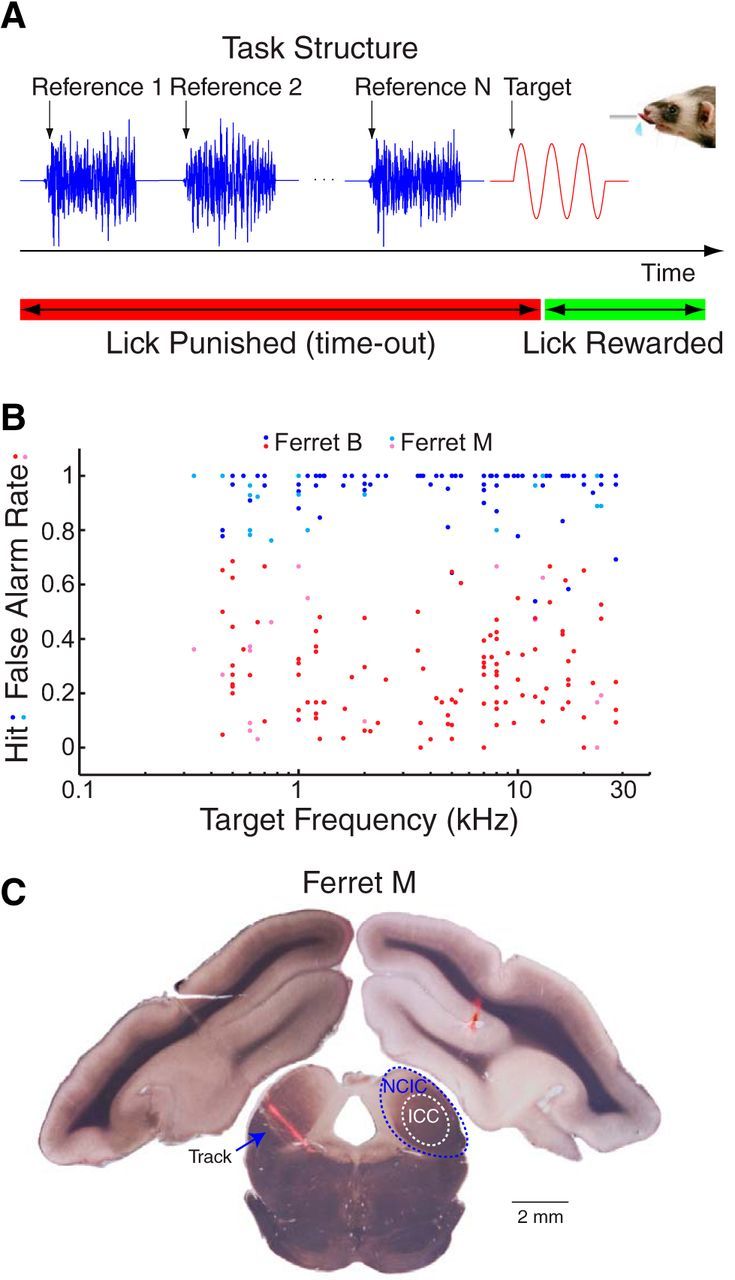
Figure 2.

Methods and behavioral results. A, During the task, ferrets were required to report a pure tone target (red) following a random number of reference noise sounds (blue). Ferrets were rewarded with water for licking a spout 0.2–1.2 s after target onset (green bar) and punished with a timeout for licking earlier (red bar). B, Hit rate (blue, cyan) and false alarm rate (red, magenta) are plotted against target frequency for all behavior sessions in two ferrets (B and M) during neural recordings in the IC. (Ferret B performed in 111 sessions and Ferret M performed in 18). Since the BF often matched the target frequency (95 of 129 sessions), this plot also shows the range of BFs sampled in the IC. C, Coronal section of the brain of Ferret M at the level of the IC. The arrow marks a fluorescently labeled track that passed through the left IC. Dotted lines on the right IC indicate the approximate borders between the ICC and NCIC divisions of the IC.
