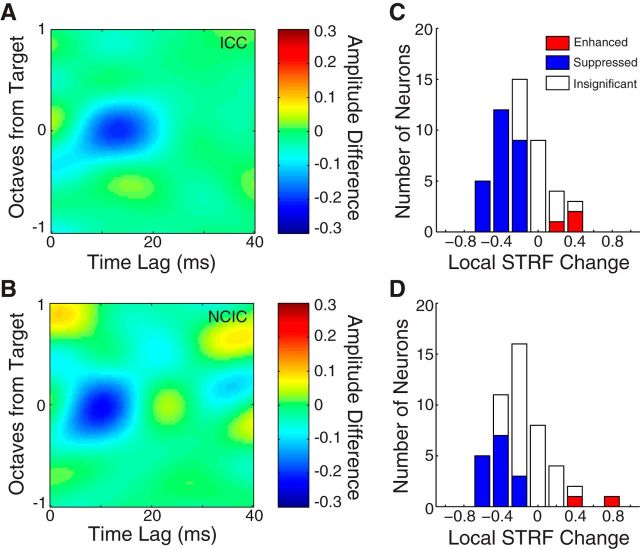
Figure 4.
STRFs are suppressed at the target frequency during behavior. A, Average STRF difference between active and passive behavioral conditions, aligned at the target frequency (all targets <0.5 octaves from BF) and averaged over all ICC neurons (N = 48). The blue region indicates average suppression around the target frequency. B, Same format as A for all NCIC neurons (N = 47). C, Histogram plots the local STRF change (fraction difference between the behaving and passive STRF in a 1 octave band centered at the target frequency) in each ICC neuron. Filled bars indicate 29 neurons with significant changes (p < 0.05, jackknifed t test). D, Same format as C for NCIC neurons. The median changes in ICC (−0.32, p < 1e-4, signed-rank test) and NCIC (−0.42, p = 0.002, signed-rank test) were not significantly different (p = 0.27, rank-sum test).

