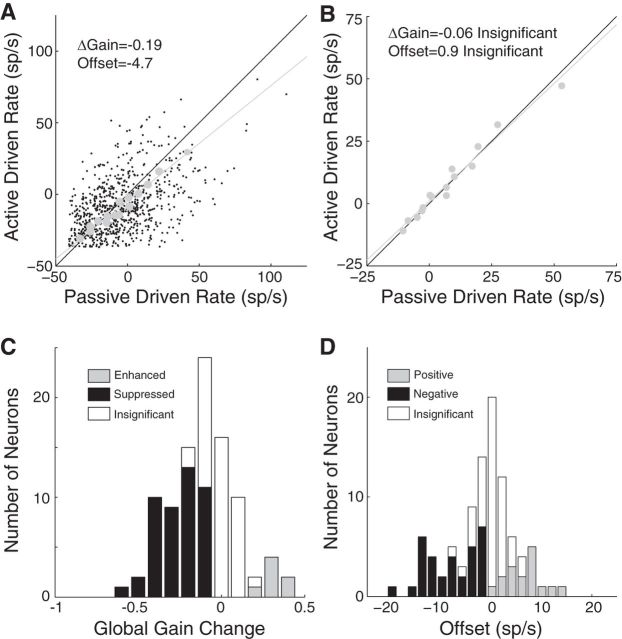
Figure 5.
Task-related plasticity has a global component. A, Scatter plot of driven firing rates (small black points) for each 5 ms bin during reference stimuli in active versus passive conditions for one neuron. A small amount of variability has been added to visualize overlapping points. Gray line plots the best linear fit to the binned rates (gray points). The global gain change (−0.19 = slope of best fit line − 1) and offset (y intercept of best fit line) reflect suppression during behavior relative to the passive state. B, Same format as A for a neuron with no change during behavior (global gain change and offset are not significantly different from 0). C, Histogram plots the global gain change in each IC neuron (both ICC and NCIC). Filled bars indicate the global gain changes that are significantly different from 0 (median, −0.20, p < 1e-7, signed-rank test). D, Histogram plots the offset in each IC neuron. Filled bars indicate the offsets that are significantly different from 0 (median, −3.2 spikes/s or −4% of the firing rate range, p = 0.029, signed-rank test). sp/s, spikes/second.

