Figure 9.

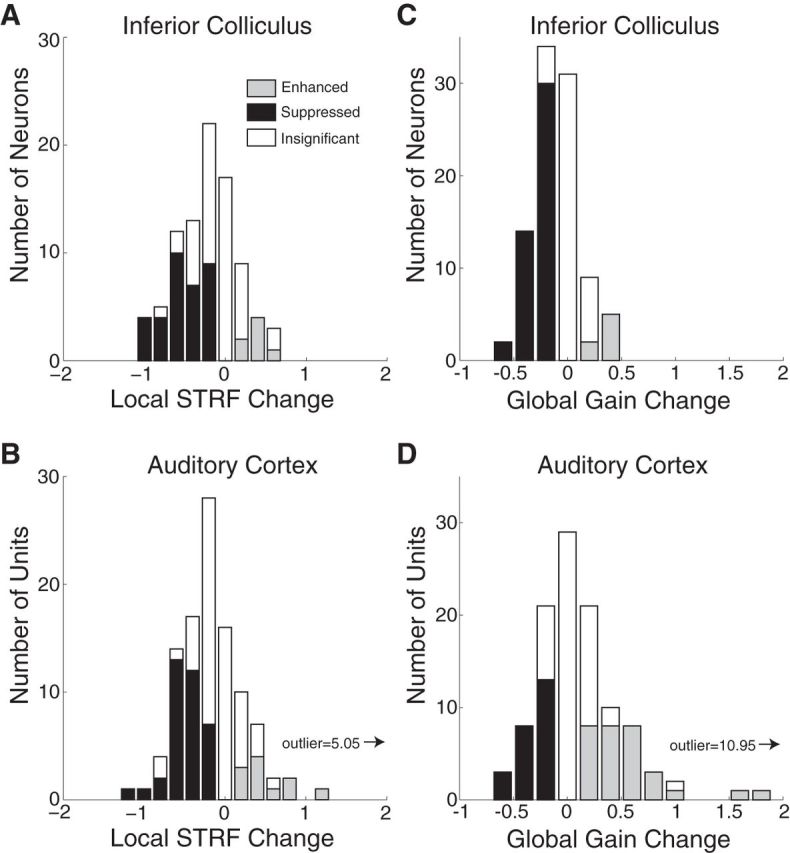
Comparison of task-related plasticity between the IC and A1. A, Histogram plots the local STRF change in each IC neuron. (IC data from Fig. 4 reanalyzed using a ⅓ octave band to match the A1 analysis published previously). Filled bars indicate 41 neurons showing significant changes (p < 0.05, jackknifed t test). B, Same format as A for 108 units in A1. The dataset contains a combination of single neurons and multiunits (see Materials and Methods). Filled bars indicate 48 units with significant changes. Arrow indicates one outlier with a very large local STRF change. The median local STRF changes in the IC (−0.47, p < 1e-10) and A1 (−0.38, p < 1e-3) were not significantly different (p = 0.40, rank-sum test). C, Histogram plots the global gain change in each IC neuron (data from Fig. 5C but with 2× wider bins). Filled bars indicate significant changes (p < 0.05, jackknifed t test). D, Same as C for the 108 A1 units. Note the large number of units with positive global gain changes (gray). The arrow indicates one outlier with a very large global gain change. The median global gain changes in the IC (−0.20, p < 1e-7) and A1 (0.23, p = 0.42) were significantly different (p < 1e-3, ranked-sum test).
