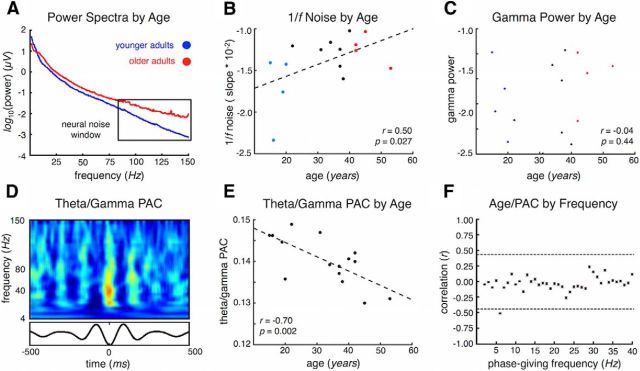
Figure 2.
ECoG results. A, Averaging power spectra by adults younger than 21 years (blue) and older than 40 years (red) illustrates the differences in the slope of high gamma power (outlined by the black box); the high-frequency power “flattens out,” indicative of increased 1/f noise. B, Experimental results showing that, with increasing participant age, there is increased 1/f noise without (C) a concomitant age-related increase in gamma power. Blue and red dots represent the subjects averaged in A. D, Example PAC comodulogram from one participant showing the relationship between theta phase (4–8 Hz, bottom oscillation) and amplitude at frequencies from 4 to 150 Hz. E, Experimental results showing that theta/high gamma PAC decreases as a function of participant age. F, Age-related changes in frontal and auditory PAC are specific to theta/high gamma PAC, as opposed to other phase-giving frequency bands. Dashed lines in F indicate significance cutoff (p < 0.05, uncorrected). Error bars indicate SEM.

