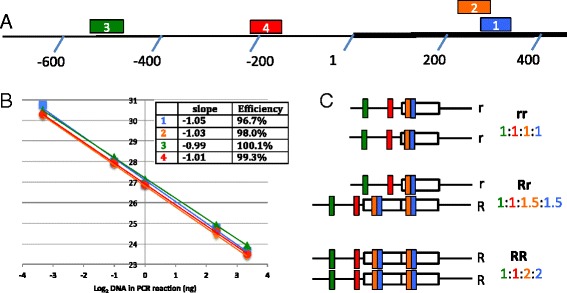
Figure 1.

Characterization of the primers used in the test. A. The region of chromosome 18 under investigation is shown, with the repeat region indicated by a darker line, and chromosome position indicated as +/- with respect to the first nucleotide of the repeat. Four primer sets are used, and the regions amplified by each are indicated as 1, 2, 3 and 4 in the image. Primer sets 1 and 2 amplify a region within the repeat, primer sets 3 and 4 amplify a region outside of the repeat. B. Primer efficiency for each set of primers. Four different concentrations of starting template were amplified with each primer set and Ct values were recorded on the y-axis. Colors used are the same as in panel A. Inset: slopes from the best-fit lines and corresponding calculated efficiency values. C. Location of the regions amplified in dogs of three different genotypes. Colors used are the same as in panel A. The ratio of products expected for each genotype is indicated.
