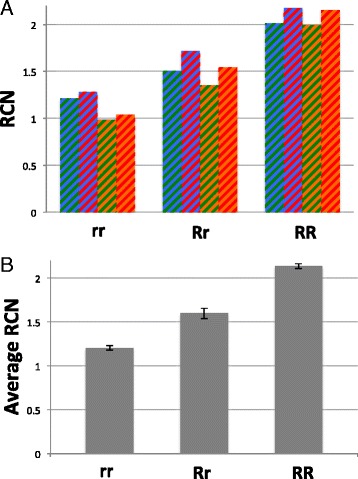
Figure 2.

Genotype determination. A. Three dogs of known genotype were selected. DNA from these dogs was analyzed by qPCR and RCN values calculated. Each bar represents a different set of comparison of PCR products: Blue/Green refers products 1 and 3; Blue/Red is 1 and 4; Orange/Green is 2 and 3; Orange/Red is 2 and 4. B. Average RCN values were calculated for each dog and the experiment repeated four times so that values could be compared to each other. All three means were shown to be different from each other (p << 0.05).
