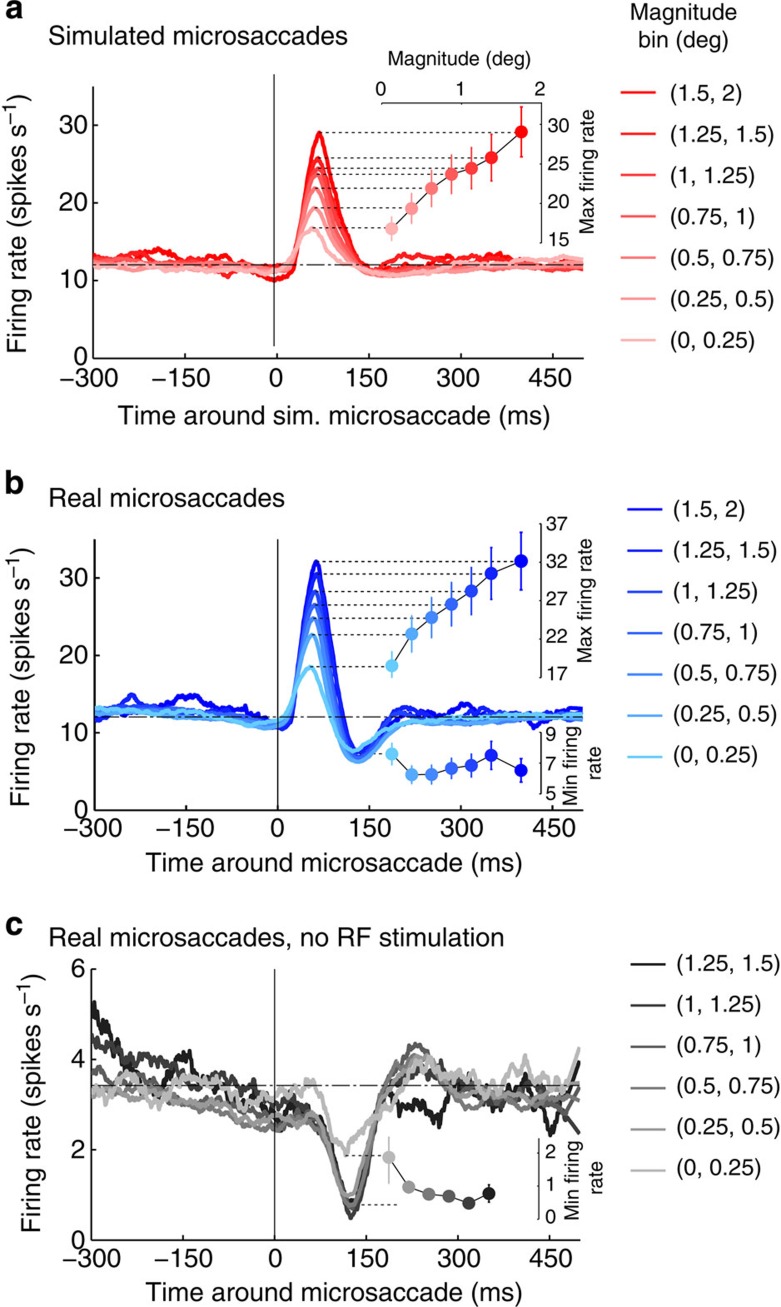
Figure 5. Effects of microsaccade magnitude on neuronal responses.
Population data showing the peri-microsaccade modulation of V1 responses for (a) simulated microsaccades (N=145 neurons) and (b) real microsaccades (N=145 neurons) of different magnitudes, and (c) real microsaccades in the absence of a visual stimulus in the neuron's RF (N=52 neurons). (a–c) The insets show the peak or trough values of the PMTH for the different microsaccade magnitude bins: peaks grow with microsaccade magnitude, whereas troughs do not. Error bars represent the s.e.m. across neurons. Note: in c, there were insufficient data to calculate the PMTH for microsaccades larger than 1.5 deg, as we required a minimum of 600 microsaccades (for all recorded neurons in the given condition) in each bin to perform the analysis.

