
Figure 4.
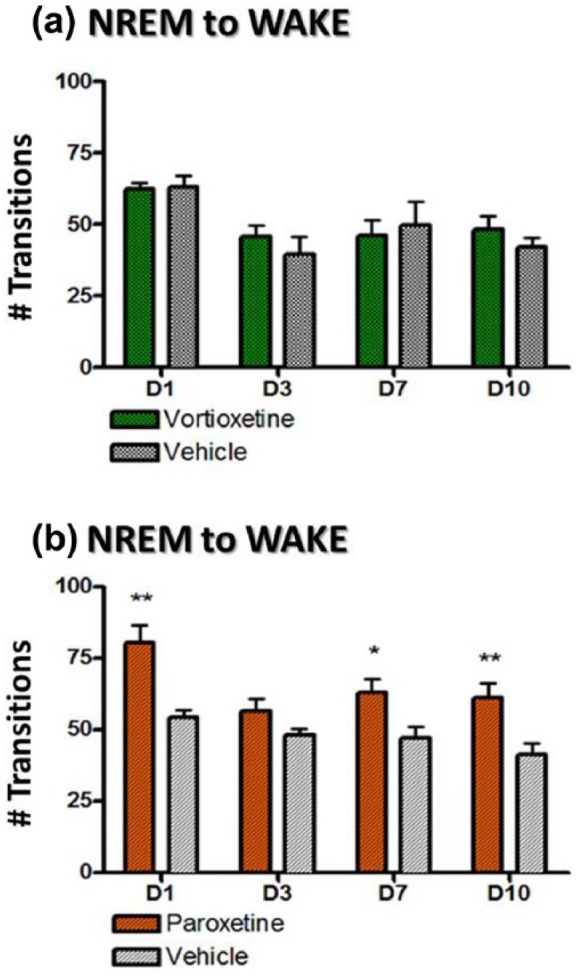
The mean (±standard error of the mean (SEM)) number of transitions from non-rapid eye movement (NREM) to wake during days 1, 3, 7 and 10 and calculated for 24 h after drug administration for day 1 and the time-matched 24-hour period for all other days. Each treatment group was compared to its respective vehicle control for each day separately (*p<0.05; **p<0.01; ***p<0.005).