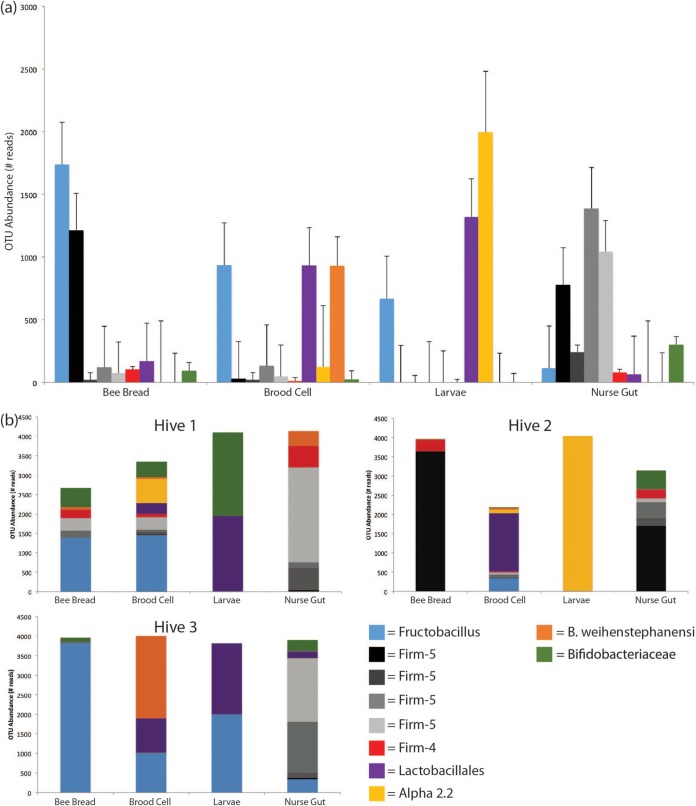
FIG 2.
Sequence abundance of the top 10 LAB OTUs cultured from each of four subsampled honey bee environment, in three hives, binned at 99% identity based on 16S rRNA sequencing. (a) Average OTU abundances for each sampled environment for each of the top 10 OTUs. The data were compiled and averaged from each of three sampled hives. Error bars are the results of three independent biological replicates. (b) Sequence abundance for the top 10 OTUs found in each of three sampled hives across four environments.

