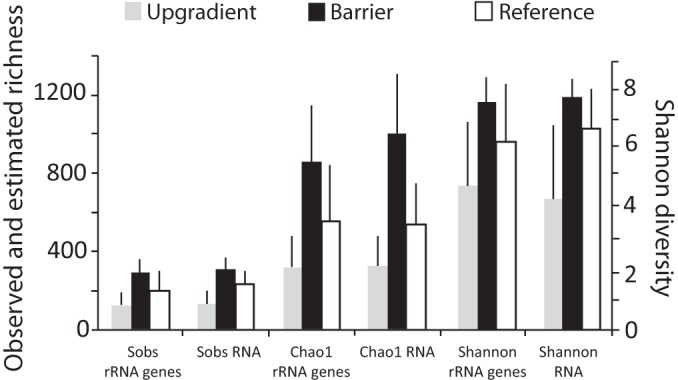
FIG 2.

Total number of observed taxa (Sobs), Chao1 richness estimates, and Shannon diversity indices of the bacterial community composition derived from analysis of 16S rRNA and 16S rRNA genes for samples collected from upgradient (gray bars), barrier (black bars), and reference (white bars) wells. Error bars show standard errors.
