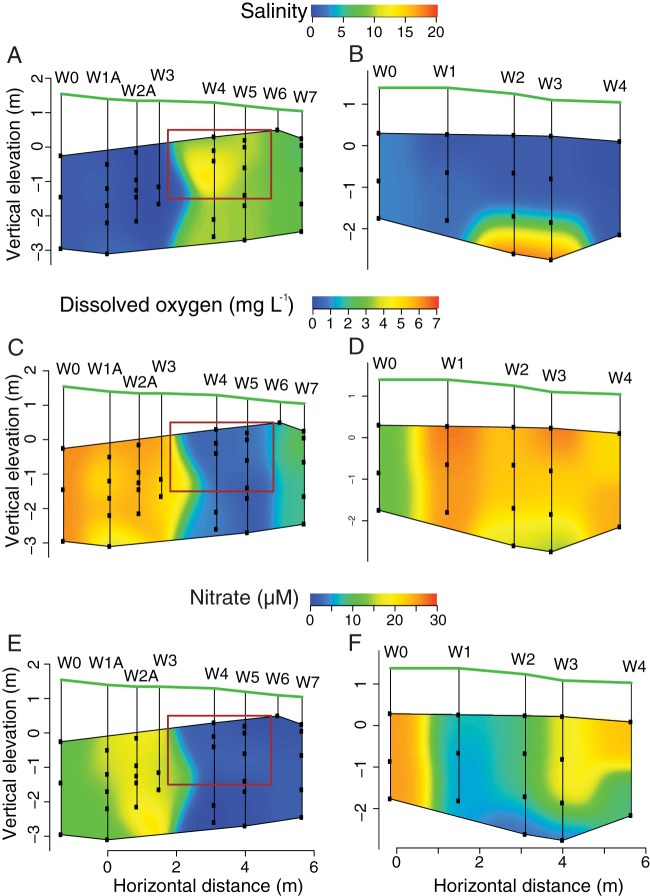
FIG 4.
Contour plots of the aquifer region upgradient and within the PRB (A, C, and E) and in a section of aquifer adjacent to the PRB that served as a reference location (B, D, and F). Sampling wells W0 to W3 correspond to areas upgradient of the PRB, W4 to W6 represent samples within the PRB, and W7 is downgradient of the PRB. The red box represents the specific location of the PRB, and the black dots represent the location of discrete-depth sampling wells. The green line indicates the surface of the beach.

