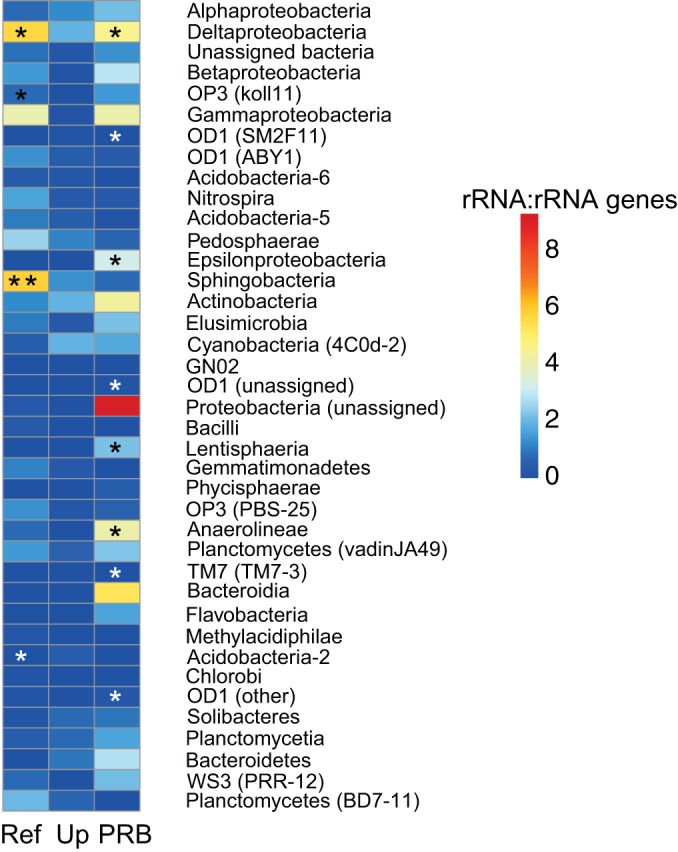
FIG 7.

Heat map of the average ratio of 16S rRNA to rRNA genes for bacterial classes in the reference (Ref), upgradient (Up), and PRB sites. A significant result indicates that that class expressed significantly more (black asterisks) or significantly less (white asterisks) 16S rRNA relative to 16S rRNA genes. *, P < 0.05; **, P < 0.005.
