
FIG 2.
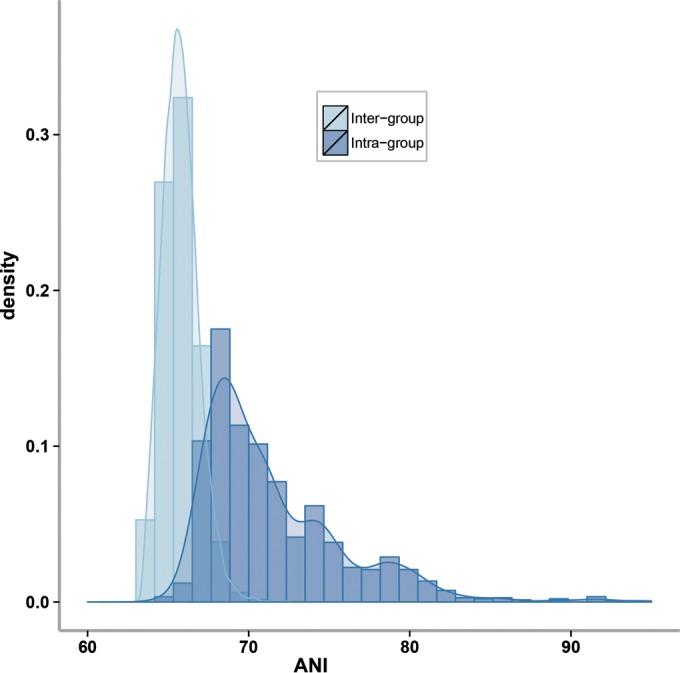
ANI distribution based on all the analyzed genome sequences of the genera Lactobacillus and Pediococcus. Dark blue represents pairwise ANI values calculated between strains in the same group, and light blue represents those between strains from different groups.