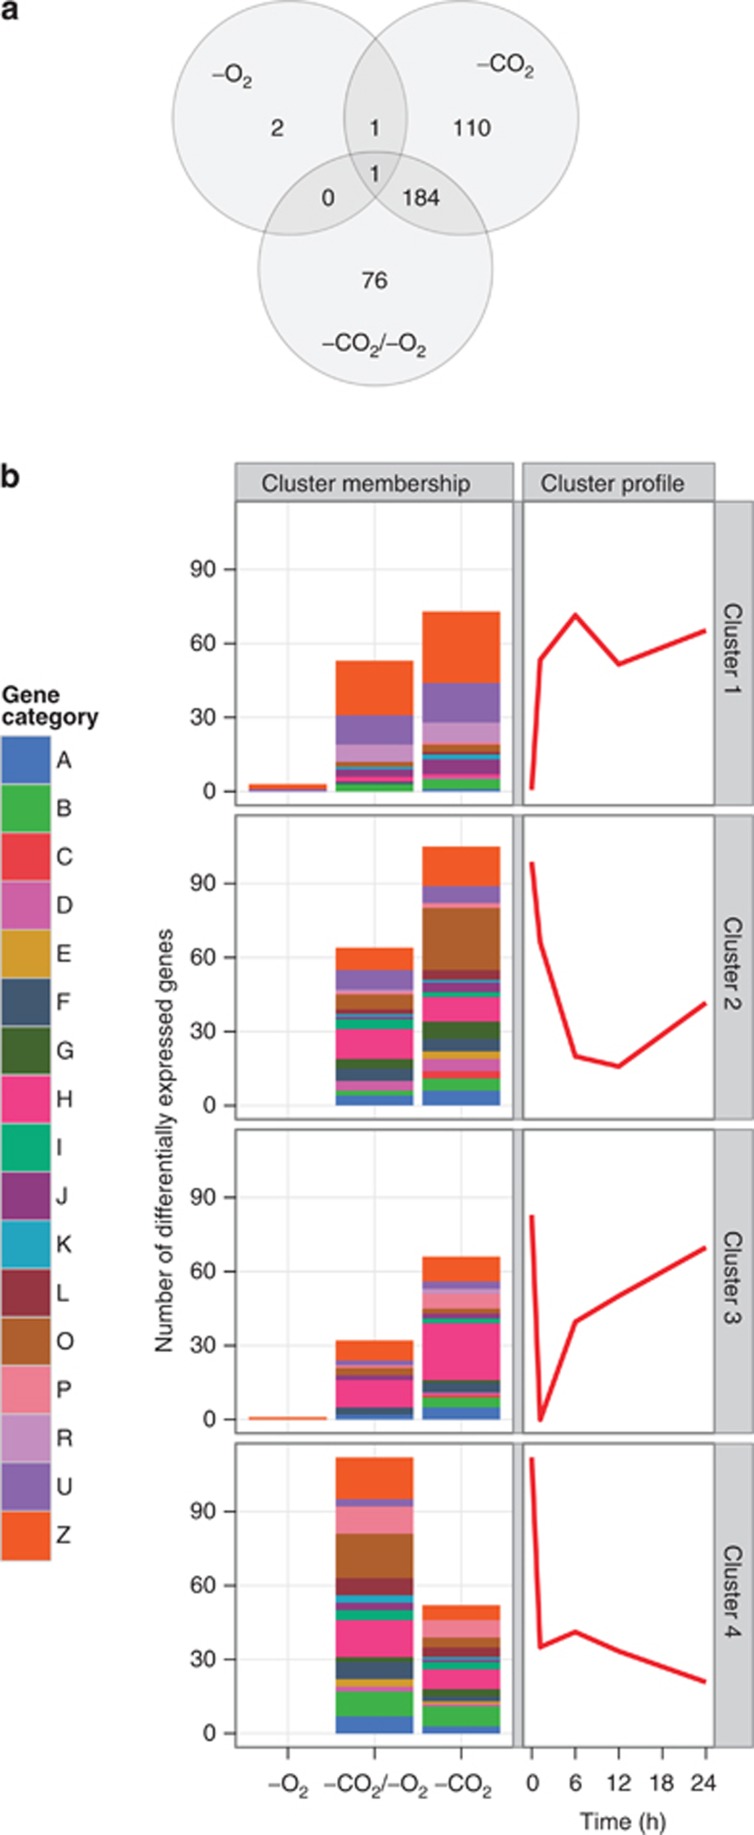
Figure 2.
(a) Results of whole-genome transcriptional profiling in the gas shock experiment. Venn diagram of genes showing significant differential expression with respect to air in the three experimental conditions: −O2 shock (0.036% CO2, 0% O2), −CO2 shock (0.004% CO2, 21% O2) and −CO2/−O2 shock (0.004% CO2, 0% O2). (b) Clustering analysis of changes in gene expression under gas shocks relative to changes in air. Autoscaled cluster centroids are shown at right, in red. Clusters 2 and 3 are categorized as showing suppression and subsequent recovery. At left, bar plots give the number of genes in each cluster under each gas shock condition. Gene categories: A, amino-acid biosynthesis; B, biosynthesis of cofactors, prosthetic groups, and carriers; C, cell envelope; D, cellular processes; E, central intermediary metabolism; F, energy metabolism; G, fatty acid, phospholipid, and sterol metabolism; H, photosynthesis and respiration; I, purines, pyrimidines, nucleosides, and nucleotides; J, regulatory functions; K, DNA replication, recombination, and repair; L, transcription; O, translation; P, transport and binding proteins; R, RNA; U, other categories; Z, hypothetical proteins.

