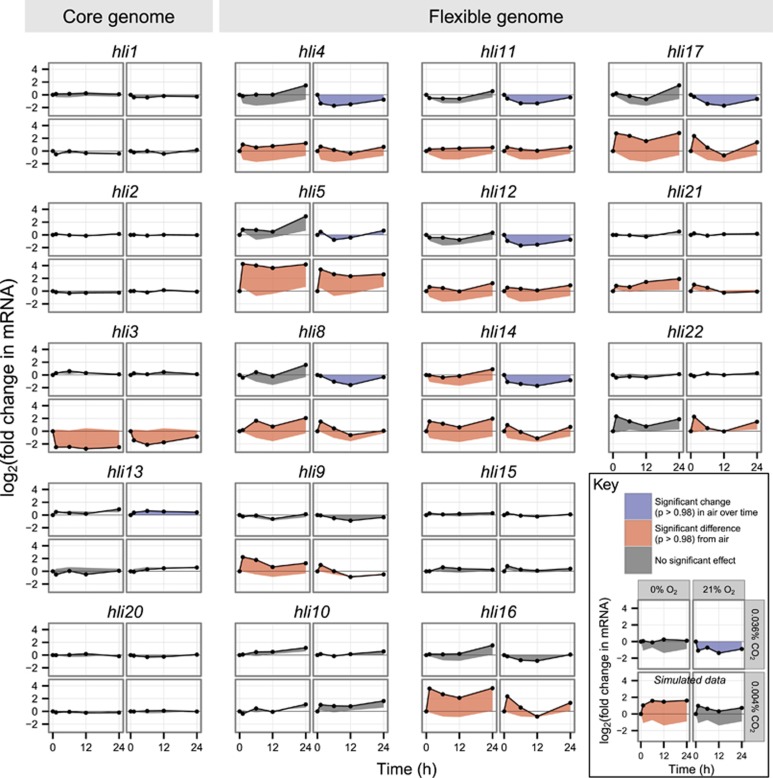
Figure 3.
Expression of high-light-inducible (hli) genes of the core (left) and flexible (right) MED4 genome in the gas shock experiment. Data points are the geometric means of two biological replicates. Fold change is relative to t=0 for each condition. All thumbnail plots share the same layout; for details, see sample plot at lower right. Data in sample plot (see Key) is simulated for illustration. The region between each time course and the baseline used for significance testing (for the air control, expression at t=0; for experimental conditions, the parallel time course in air) is shaded according to the outcome of that test: a significant change in expression in air with respect to t=0, blue; a significantly different time course in an experimental condition than in air, red; no significant effect, gray.

