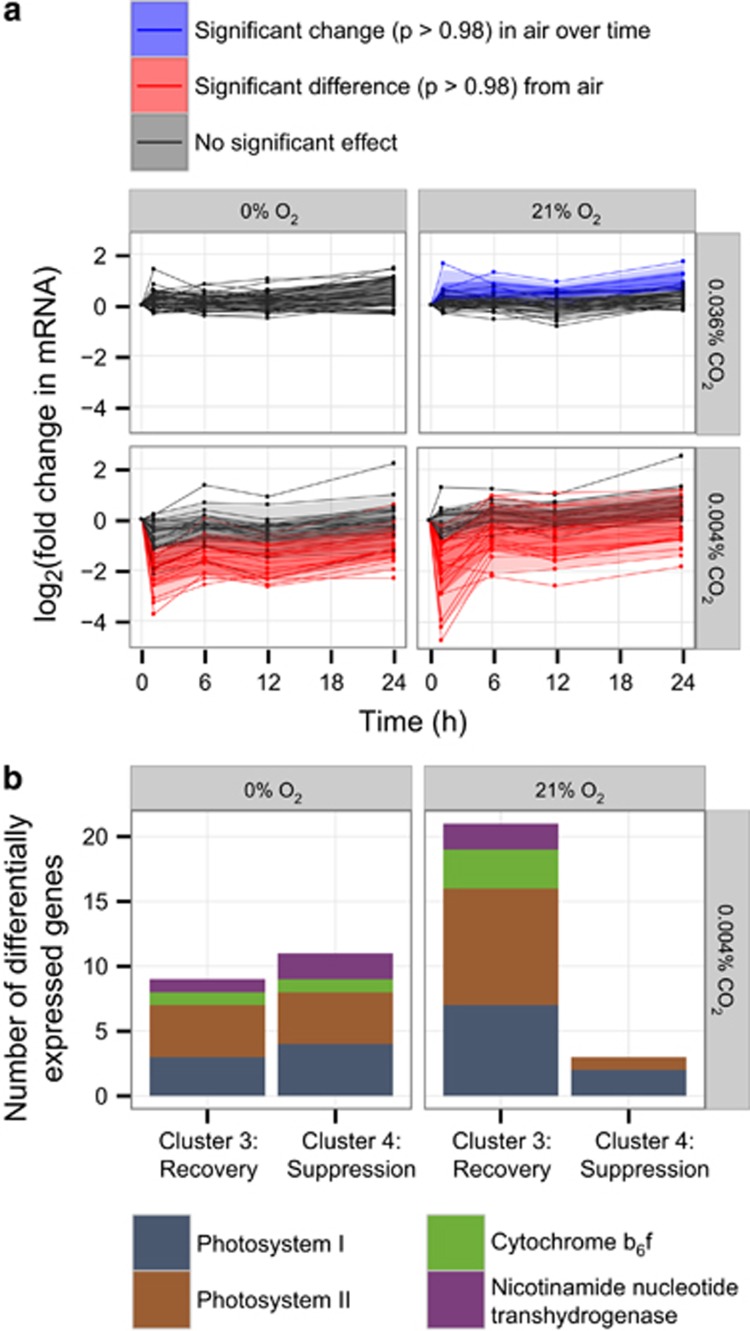
Figure 6.
(a) Expression of MED4 genes encoding PSI and PSII, cytochrome b6f and pnt genes in the gas shock experiment. Data points are the geometric means of two biological replicates. Fold change is relative to t=0 for each condition. Shock conditions causing significant differential expression in the air control with respect to time 0 are highlighted in blue; shock conditions causing significant differential expression over the time course with respect to air are highlighted in red. Ninety percent of data points lie within the outer (light) shaded bands; 70% lie within the inner (dark) bands. (b) Oxygen dependence of the cluster affiliations of the genes in panel a under carbon limitation. No differentially expressed genes in this set fell into cluster 1 (increased expression) or 2 (delayed recovery). See Figure 2b for cluster profiles.

